Introduction
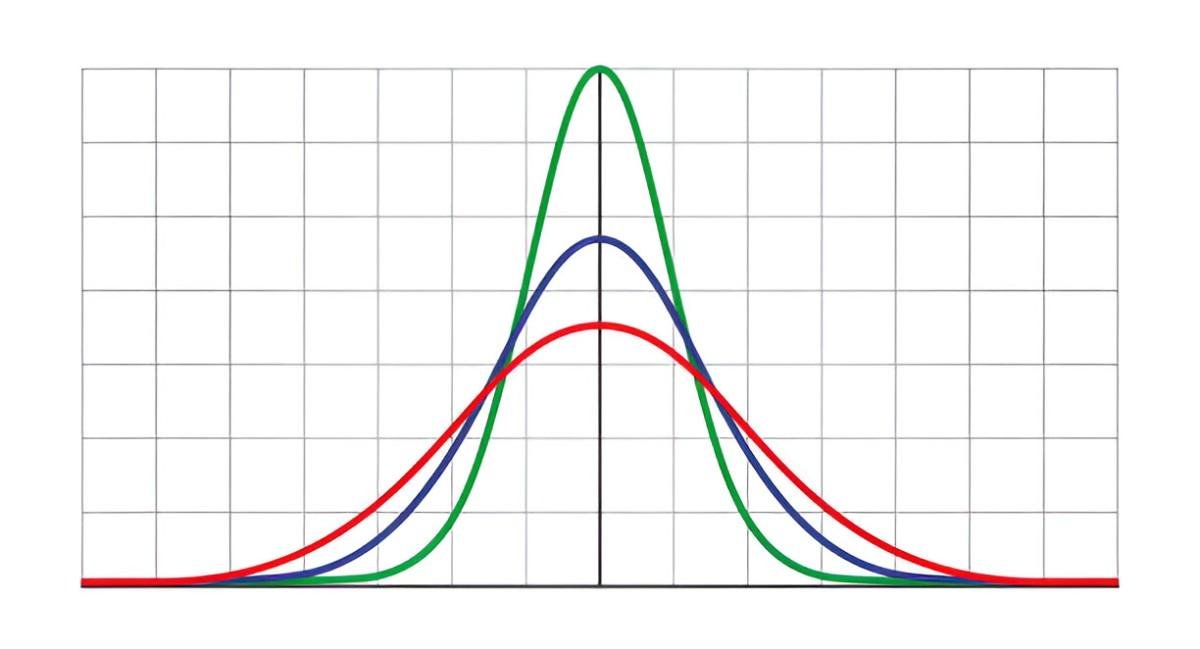
When I first started analyzing financial data, I needed a straightforward way to understand how numbers varied from their average. That’s when I discovered mean deviation – a concept that changed how I viewed data analysis. Unlike more complex measures, mean deviation gives me an intuitive sense of variability without advanced mathematics.
Table of Contents
What Exactly Is Mean Deviation?
Mean deviation (also called mean absolute deviation) measures how far data points typically lie from their average value. It answers a simple question: “On average, how much do these numbers differ from their mean?”
The formula looks like this:
Where:
- n = number of data points
- x_i = individual data value
- \bar{x} = mean of all values
Why Mean Deviation Matters in Real-World Analysis
Clear Interpretation
Mean deviation expresses variability in the original units. If I’m analyzing stock prices in dollars, the MD will be in dollars too.
Resistant to Distortion
A single extreme value affects mean deviation less than it affects standard deviation. This makes MD more reliable for small datasets.
Computational Simplicity
I can calculate it by hand without complex operations – just subtraction and absolute values.
Calculating Mean Deviation: A Step-by-Step Example
Let’s analyze the daily closing prices of Tesla stock over five trading days:
| Day | Price ($) |
|---|---|
| 1 | 250.50 |
| 2 | 248.75 |
| 3 | 253.20 |
| 4 | 245.90 |
| 5 | 255.00 |
Step 1: Find the Mean Price
\bar{x} = \frac{250.50 + 248.75 + 253.20 + 245.90 + 255.00}{5} = 250.67Step 2: Calculate Absolute Deviations
| Day | Deviation from Mean | Absolute Deviation |
|---|---|---|
| 1 | 250.50 – 250.67 = -0.17 | 0.17 |
| 2 | 248.75 – 250.67 = -1.92 | 1.92 |
| 3 | 253.20 – 250.67 = 2.53 | 2.53 |
| 4 | 245.90 – 250.67 = -4.77 | 4.77 |
| 5 | 255.00 – 250.67 = 4.33 | 4.33 |
Step 3: Compute the Mean Deviation
MD = \frac{0.17 + 1.92 + 2.53 + 4.77 + 4.33}{5} = 2.74This tells me Tesla’s price typically deviates by $2.74 from its average during this period.
How Mean Deviation Compares to Other Measures
Understanding when to use MD versus alternatives is crucial:
| Measure | Calculation Method | Sensitivity to Outliers | Common Uses |
|---|---|---|---|
| Mean Deviation | Absolute differences | Moderate | Quick assessments, small datasets |
| Standard Deviation | Squared differences | High | Financial models, research studies |
| Range | Max – Min values | Extreme | Initial data exploration |
| Interquartile Range | Middle 50% values | Low | Skewed distributions |
Practical Applications in Finance
Portfolio Analysis
I use mean deviation to compare the consistency of different investments. A lower MD suggests more stable returns.
Risk Assessment
When evaluating a new stock, MD helps me understand its typical price fluctuations.
Performance Tracking
Comparing MD before and after a strategy change shows if it reduced variability.
Common Misconceptions About Mean Deviation
“It’s Just Like Standard Deviation”
While related, they measure variability differently. Standard deviation weights extreme values more heavily.
“It’s Outdated”
Many analysts prefer MD for its simplicity, especially in preliminary analyses.
“Always Better for Small Samples”
While often true, the choice depends on your specific analysis goals.
Historical Context
The concept dates back to Gauss’s work in the early 1800s. Statisticians initially preferred mean deviation before computational tools made standard deviation more practical.
Implementing Mean Deviation in Spreadsheets
In Excel or Google Sheets, I use:
=AVERAGE(ABS(range - AVERAGE(range)))For our Tesla example:
=AVERAGE(ABS(B2:B6 - AVERAGE(B2:B6)))When to Choose Mean Deviation Over Alternatives
Ideal Situations:
- Quick, intuitive variability assessment
- Small datasets with potential outliers
- Non-technical audiences
Less Suitable:
- Advanced statistical modeling
- Normally distributed large datasets
- When extreme values carry special significance
Limitations to Consider
Mathematical Properties
The absolute value function isn’t differentiable at zero, limiting some advanced applications.
Sample Size Effects
Like all measures, MD becomes more reliable with more data points.
Industry Standards
Many financial models use standard deviation, so MD results may need conversion.
Conclusion
Mean deviation remains one of the most accessible tools for understanding data variability. Its straightforward calculation and interpretation make it invaluable for quick assessments and preliminary analyses. While standard deviation dominates many advanced applications, MD’s resistance to outliers and intuitive meaning keep it relevant in my analytical toolkit.


