As someone who has spent years analyzing financial trends and accounting data, I recognize the power of longitudinal studies in uncovering patterns over time. Whether tracking stock market fluctuations, consumer spending habits, or corporate financial health, longitudinal research designs provide insights that cross-sectional studies simply cannot match. In this guide, I break down the fundamentals of longitudinal studies, their advantages, challenges, and real-world applications—especially in finance and economics.
Table of Contents
What Is a Longitudinal Study?
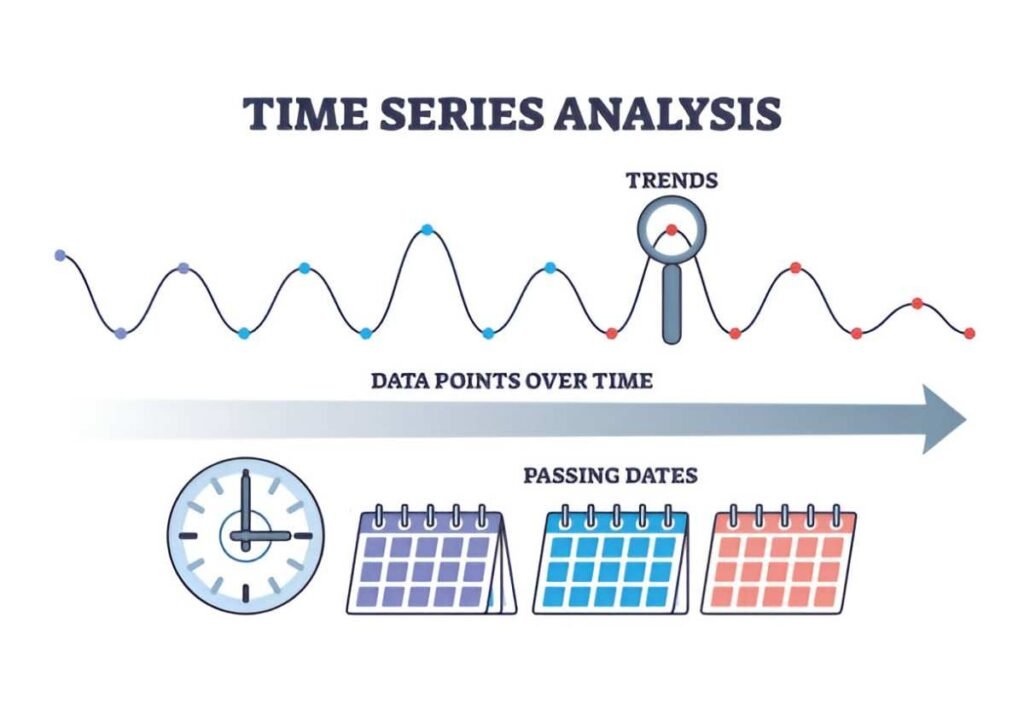
A longitudinal study tracks the same subjects—whether individuals, companies, or economic indicators—over an extended period. Unlike cross-sectional research, which captures a single snapshot, longitudinal designs reveal trends, causality, and developmental trajectories.
For example, if I analyze the quarterly revenue growth of Fortune 500 companies over a decade, I’m conducting a longitudinal study. The key feature is repeated measurements. The simplest mathematical representation of a longitudinal model is:
Y_{it} = \alpha + \beta X_{it} + \epsilon_{it}Here, Y_{it} represents the outcome for subject i at time t, X_{it} is the predictor variable, \alpha is the intercept, \beta is the coefficient, and \epsilon_{it} is the error term.
Types of Longitudinal Studies
1. Panel Studies
Panel studies follow the same subjects over time. The U.S. Census Bureau’s Survey of Income and Program Participation (SIPP) is a classic example, tracking household economic conditions annually.
2. Cohort Studies
Cohort studies examine a specific group sharing a common characteristic. The National Longitudinal Study of Adolescent to Adult Health (Add Health) follows individuals born in the 1980s to understand health and economic outcomes.
3. Trend Studies
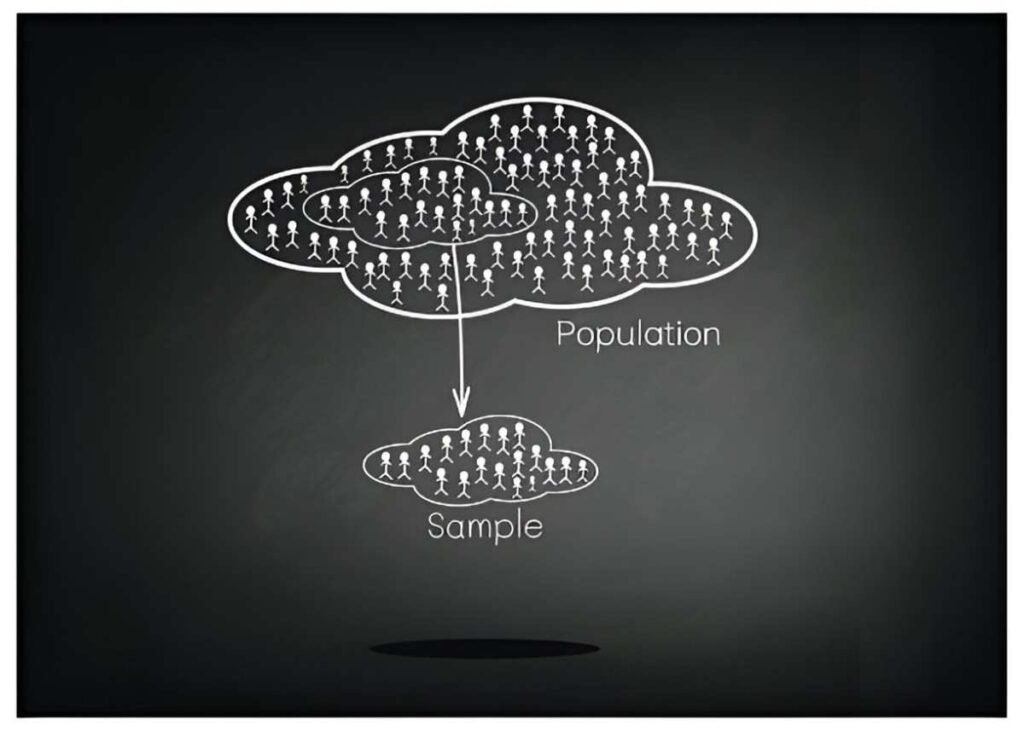
Trend studies analyze different samples from the same population over time. The Federal Reserve’s Survey of Consumer Finances (SCF), conducted every three years, assesses wealth distribution trends without tracking the same households.
4. Retrospective Studies
These rely on historical data. For instance, I might analyze a company’s 10-K filings from the past 20 years to study profitability trends.
Advantages of Longitudinal Research
1. Captures Temporal Changes
Cross-sectional data can’t distinguish whether a correlation implies causation. Longitudinal designs help determine if X leads to Y by observing sequences.
2. Reduces Cohort Effects
Comparing different age groups at one time (cross-sectional) may conflate age and generational differences. Longitudinal studies avoid this by following the same cohort.
3. Identifies Long-Term Trends
In finance, understanding how recessions impact corporate debt ratios requires multi-year tracking. A study might model debt-to-equity (\frac{D}{E}) over time:
\frac{D_{it}}{E_{it}} = \beta_0 + \beta_1 \text{Recession}t + \beta_2 \text{InterestRate}_t + \epsilon{it}Challenges in Longitudinal Studies
1. Attrition Bias
Subjects drop out over time, skewing results. If high-income households leave a wealth survey, the remaining sample underrepresents economic diversity.
2. Cost and Time-Intensiveness
Tracking variables for years demands funding and patience. The Panel Study of Income Dynamics (PSID), ongoing since 1968, costs millions annually.
3. Measurement Consistency
Changing survey questions or accounting standards (e.g., GAAP updates) complicates comparisons.
Longitudinal vs. Cross-Sectional Studies
| Feature | Longitudinal Study | Cross-Sectional Study |
|---|---|---|
| Time Frame | Multiple time points | Single time point |
| Data Depth | Tracks changes | Snapshot |
| Causality Inference | Stronger | Weaker |
| Cost | Higher | Lower |
| Attrition Risk | Yes | No |
Applications in Finance and Economics
1. Credit Risk Modeling
Banks use longitudinal data to predict defaults. A logistic regression model might estimate the probability (P) of default:
P(\text{Default}{it} = 1) = \frac{1}{1 + e^{-(\beta_0 + \beta_1 \text{CreditScore}{it} + \beta_2 \text{Unemployment}_{it})}}2. Market Research
Tracking consumer spending habits helps firms adjust strategies. If a longitudinal study shows declining demand for a product, companies can pivot early.
3. Policy Evaluation
Did the 2017 Tax Cuts and Jobs Act boost corporate investment? Longitudinal analysis of capital expenditure (\text{CAPEX}) before and after the policy provides answers.
How to Design a Longitudinal Study
1. Define the Research Question
Example: How does minimum wage growth affect small business profitability over five years?
2. Select the Time Frame
Too short, and trends are unclear; too long, and costs balloon. A balance (e.g., 5–10 years) works for most economic studies.
3. Choose the Sample
Random sampling reduces bias. Stratified sampling ensures representation (e.g., including businesses of different sizes).
4. Collect Data Consistently
Use the same metrics (e.g., net profit margin \frac{\text{Net Profit}}{\text{Revenue}}) at each interval.
5. Analyze with Appropriate Models
Fixed-effects models control for unobserved variables:
Y_{it} = \alpha_i + \beta X_{it} + \epsilon_{it}Here, \alpha_i captures individual-specific effects.
Real-World Example: Retirement Savings Study
Suppose I track 1,000 Americans’ 401(k) contributions from age 30 to 60. A growth curve model estimates how savings (S) change with age (A):
S_{it} = \beta_0 + \beta_1 A_{it} + \beta_2 A_{it}^2 + \epsilon_{it}The quadratic term (A^2) captures nonlinear growth—contributions may rise until age 50, then decline as retirement nears.
Final Thoughts
Longitudinal studies are indispensable in finance, economics, and beyond. They reveal what static data cannot: the dynamics of change. While resource-intensive, their ability to untangle causality and forecast trends makes them invaluable. Whether you’re a researcher, investor, or policymaker, mastering longitudinal designs equips you to make data-driven decisions with confidence.


