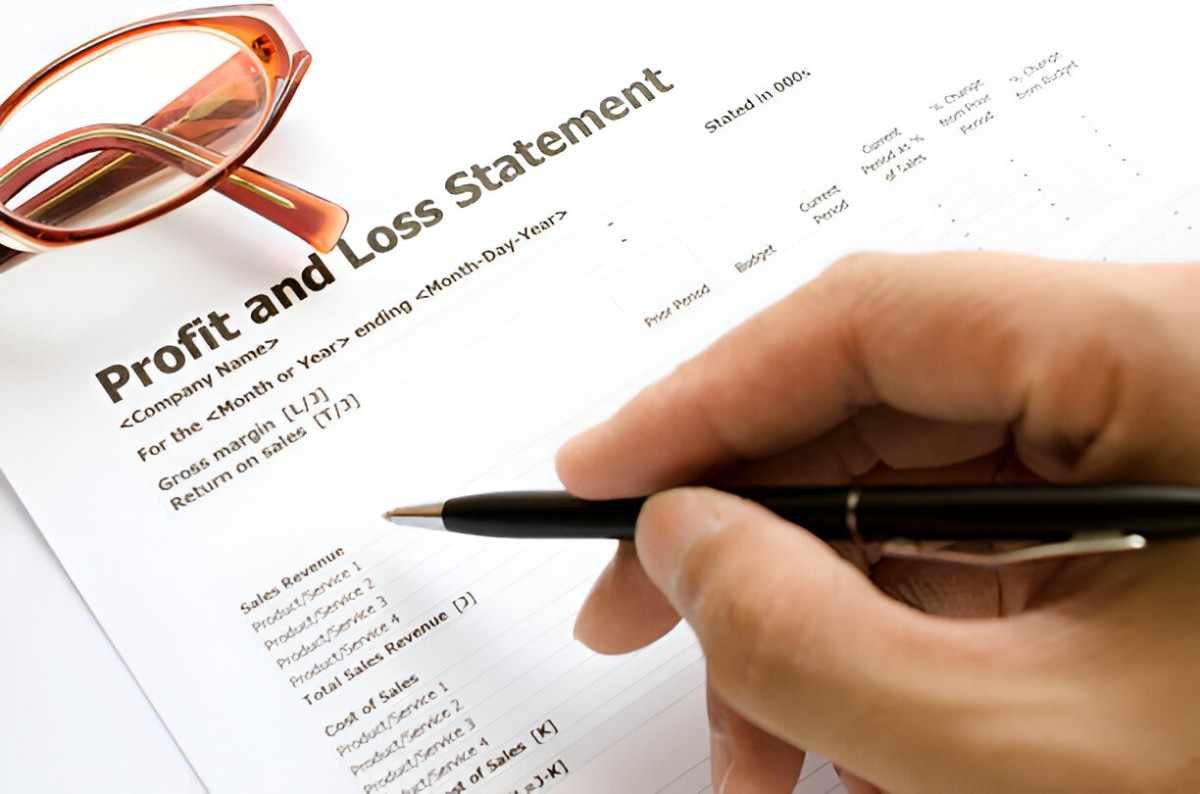
As someone who has spent years analyzing financial statements, I understand how intimidating a Profit and Loss (P&L) statement can seem at first glance. But trust me, once you break it down, it’s one of the most straightforward tools in finance. Whether you’re a small business owner, an investor, or just curious about how companies measure performance, this guide will help you understand P&L statements inside out.
Table of Contents
What Is a Profit and Loss Statement?
A Profit and Loss statement, also called an income statement, summarizes a company’s revenues, costs, and expenses over a specific period. Unlike a balance sheet, which shows a company’s financial position at a single point in time, the P&L statement reveals how much money a business made or lost during a month, quarter, or year.
The Basic Structure of a P&L Statement
Every P&L statement follows a standard structure:
- Revenue (Sales) – The total income generated from selling goods or services.
- Cost of Goods Sold (COGS) – Direct costs tied to production.
- Gross Profit – Revenue minus COGS.
- Operating Expenses – Indirect costs like salaries, rent, and marketing.
- Operating Income (EBIT) – Gross profit minus operating expenses.
- Non-Operating Items – Interest, taxes, and one-time gains/losses.
- Net Income – The final profit or loss after all expenses.
Here’s a simplified example:
| Item | Amount ($) |
|---|---|
| Revenue | 100,000 |
| Cost of Goods Sold | 40,000 |
| Gross Profit | 60,000 |
| Operating Expenses | 30,000 |
| Operating Income | 30,000 |
| Interest & Taxes | 5,000 |
| Net Income | 25,000 |
Breaking Down Each Component
1. Revenue: The Starting Point
Revenue is the lifeblood of any business. It includes all money earned from primary operations, such as product sales or service fees. Some companies also list “net revenue,” which deducts returns or discounts.
For example, if my bakery sells 1,000 cakes at $50 each, my total revenue is:
Revenue = Quantity \times Price = 1,000 \times 50 = \$50,0002. Cost of Goods Sold (COGS): What It Takes to Make the Product
COGS includes direct costs like raw materials and labor. If my bakery spends $20 on ingredients and labor per cake, COGS would be:
COGS = Quantity \times Cost\ per\ unit = 1,000 \times 20 = \$20,0003. Gross Profit: The First Measure of Profitability
Gross profit shows how efficiently a company produces its goods. The formula is:
Gross\ Profit = Revenue - COGS = 50,000 - 20,000 = \$30,000A higher gross profit means the business retains more money after production costs.
4. Operating Expenses: The Overhead Costs
These are indirect costs not tied to production, such as:
- Salaries for administrative staff
- Rent and utilities
- Marketing and advertising
If my bakery spends $10,000 on these, my operating income (EBIT) becomes:
Operating\ Income = Gross\ Profit - Operating\ Expenses = 30,000 - 10,000 = \$20,0005. Non-Operating Items: Interest and Taxes
Businesses often have additional expenses like loan interest and taxes. If I pay $2,000 in interest and $3,000 in taxes, my net income is:
Net\ Income = Operating\ Income - Interest - Taxes = 20,000 - 2,000 - 3,000 = \$15,000Why the P&L Statement Matters
For Business Owners
- Performance Tracking – Are sales growing? Are costs under control?
- Decision Making – Should I raise prices? Cut unnecessary expenses?
- Investor & Lender Confidence – Banks and investors scrutinize P&L before funding.
For Investors
- Profitability Analysis – Is the company consistently profitable?
- Trend Identification – Are revenues increasing year-over-year?
- Comparative Analysis – How does this company stack up against competitors?
Common Pitfalls to Avoid
- Mixing Personal and Business Expenses – Sole proprietors often make this mistake, skewing true profitability.
- Ignoring Non-Cash Expenses – Depreciation and amortization reduce profit but don’t involve cash outflow.
- Overlooking Seasonality – Retailers may show high profits in Q4 (holiday sales) but losses in Q1.
Advanced Metrics Derived from P&L Statements
Gross Margin
Gross\ Margin = \left( \frac{Gross\ Profit}{Revenue} \right) \times 100For my bakery:
\left( \frac{30,000}{50,000} \right) \times 100 = 60\%A 60% gross margin means I retain $0.60 from each dollar of sales after production costs.
Net Profit Margin
Net\ Profit\ Margin = \left( \frac{Net\ Income}{Revenue} \right) \times 100 \left( \frac{15,000}{50,000} \right) \times 100 = 30\%This shows overall profitability after all expenses.
Real-World Example: Analyzing a Public Company
Let’s look at a snippet of Apple Inc.’s 2022 P&L statement (simplified):
| Item | Amount ($B) |
|---|---|
| Revenue | 394.33 |
| COGS | 223.55 |
| Gross Profit | 170.78 |
| Operating Expenses | 43.89 |
| Operating Income | 126.89 |
| Interest & Taxes | 16.41 |
| Net Income | 110.48 |
Apple’s gross margin:
\left( \frac{170.78}{394.33} \right) \times 100 = 43.3\%Net profit margin:
\left( \frac{110.48}{394.33} \right) \times 100 = 28\%This means Apple keeps $0.28 of every dollar earned as profit—a strong indicator of efficiency.
Final Thoughts
Understanding a P&L statement is crucial for anyone involved in business or investing. It’s not just about whether a company is profitable, but why and how. By breaking down each component, you gain insights into operational efficiency, cost management, and long-term sustainability.


