Introduction
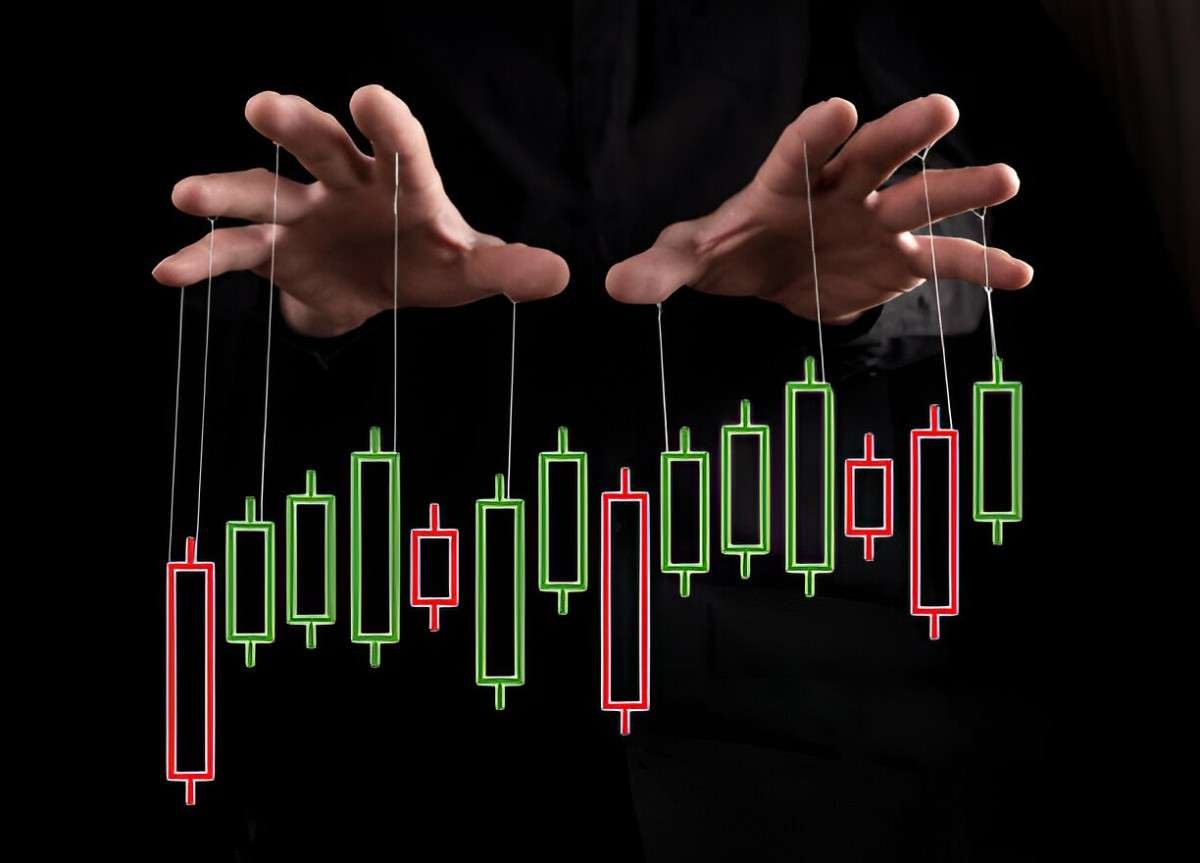
Market manipulation distorts the natural forces of supply and demand, creating artificial price movements that deceive investors. One such tactic, hammering, involves aggressive selling to push prices down, often to trigger stop-loss orders or panic selling. I will dissect hammering, explore its mechanics, and analyze its impact on markets. By the end, you will grasp how to identify it, why regulators scrutinize it, and how to protect your portfolio.
Table of Contents
What Is Hammering?
Hammering is a form of market manipulation where traders artificially depress a stock’s price through large, rapid sell orders. Unlike legitimate selling, hammering has no fundamental basis—it’s purely strategic. The goal is to create fear, force others to sell, and then buy back at a lower price.
How Hammering Works
- Initial Sell-Off: A trader dumps a large volume of shares, creating downward pressure.
- Triggering Stop-Losses: As prices drop, automated stop-loss orders execute, accelerating the decline.
- Panic Selling: Retail investors, fearing further drops, sell their holdings.
- Re-Entry: The manipulator buys back shares at a lower price, profiting from the rebound.
Consider this example:
A stock trades at P_0 = \$50. A manipulator sells 100,000 shares, pushing the price to P_1 = \$45. Stop-losses trigger, driving it to P_2 = \$40. The manipulator repurchases shares at P_2, and when the price rebounds to P_3 = \$48, they net a profit of \$8 per share.
Legal and Regulatory Perspective
The Securities Exchange Act of 1934 prohibits market manipulation. The SEC actively pursues hammering cases, but enforcement is challenging because:
- Volume Disguise: Manipulators split large orders to avoid detection.
- Layered Orders: Fake sell orders create artificial liquidity.
Notable Cases
| Case | Outcome |
|---|---|
| SEC v. Avalon FA Ltd | Fined $2.5M for spoofing and hammering |
| CFTC v. Nav Sarao | Fined for spoofing during 2010 Flash Crash |
Mathematical Model of Hammering
To quantify hammering’s impact, I use a simplified price impact model:
\Delta P = -\beta \cdot V + \epsilonWhere:
- \Delta P = Price change
- \beta = Market depth (liquidity factor)
- V = Volume sold
- \epsilon = Random market noise
If a manipulator sells V = 10,000 shares in a market with \beta = 0.001, the expected price drop is:
\Delta P = -0.001 \cdot 10,000 = -\$10Identifying Hammering
Key Indicators
- Abnormal Volume Spikes
- Sudden, unexplained surges in sell volume.
- Price Reversals
- Sharp drops followed by quick recoveries.
- Order Book Patterns
- Large sell orders clustered at key levels.
Example: Detecting Hammering in Real Time
Suppose a stock’s 5-minute chart shows:
| Time | Price | Volume |
|---|---|---|
| 10:00 AM | $50 | 5,000 |
| 10:05 AM | $48 | 25,000 |
| 10:10 AM | $45 | 50,000 |
| 10:15 AM | $47 | 10,000 |
The 10:05–10:10 AM volume spike and rapid recovery suggest hammering.
Protecting Yourself from Hammering
Strategies for Traders
- Avoid Tight Stop-Losses
- Use mental stops or wider thresholds.
- Analyze Volume Context
- Check if selling aligns with news or fundamentals.
- Trade Liquid Stocks
- Illiquid stocks are easier to manipulate.
For Long-Term Investors
- Ignore short-term volatility.
- Focus on fundamentals, not price swings.
Conclusion
Hammering exploits market psychology and liquidity gaps. While regulators combat it, traders must stay vigilant. By understanding its mechanics, you can spot manipulation and avoid its traps. Markets thrive on fairness—knowing these tactics helps keep them honest.


