Stratified sampling is one of the most powerful tools in the world of statistics and data analysis. It allows us to draw meaningful insights from complex datasets by ensuring that every subgroup within a population is adequately represented. In this guide, I will walk you through the fundamentals of stratified sampling, its applications, and how you can use it to make better decisions in finance, accounting, and beyond.
Table of Contents
What Is Stratified Sampling?
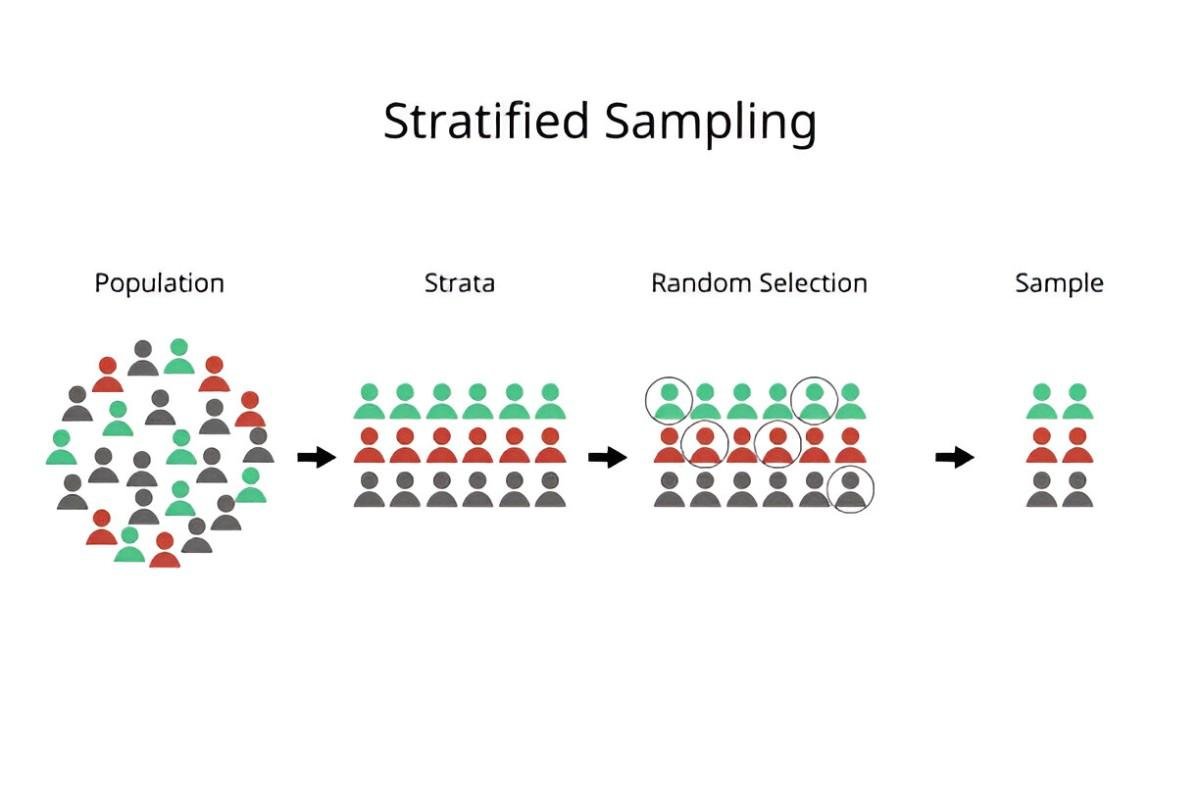
Stratified sampling is a probability sampling technique where the population is divided into distinct subgroups, or strata, based on specific characteristics. Each stratum is then sampled independently, and the results are combined to form a complete picture of the population. This method ensures that every subgroup is represented in the sample, reducing bias and improving the accuracy of estimates.
For example, imagine I want to analyze the income distribution of households in the United States. The population is diverse, with significant variations in income levels across different regions, ethnicities, and education levels. If I use simple random sampling, I might end up with a sample that overrepresents high-income households or underrepresents certain ethnic groups. Stratified sampling allows me to divide the population into strata based on these characteristics and sample each stratum proportionally.
Why Stratified Sampling Matters
In finance and accounting, stratified sampling is particularly valuable because it helps us make informed decisions based on accurate data. For instance, auditors often use stratified sampling to evaluate financial statements. By dividing transactions into strata based on dollar amounts, auditors can focus their efforts on high-value transactions while still ensuring that smaller transactions are represented.
Stratified sampling also plays a crucial role in risk management. When assessing the credit risk of a loan portfolio, I can divide the loans into strata based on credit scores, loan amounts, or other relevant factors. This allows me to identify patterns and trends that might be missed with a simple random sample.
The Mathematics Behind Stratified Sampling
To understand stratified sampling, let’s dive into the math. Suppose the population N is divided into k strata, with the size of each stratum denoted by N_1, N_2, \dots, N_k. The total population size is:
N = N_1 + N_2 + \dots + N_kIf I want to draw a sample of size n, I can allocate the sample size to each stratum proportionally. The sample size for the i^{th} stratum, n_i, is calculated as:
n_i = \left( \frac{N_i}{N} \right) \times nFor example, suppose I have a population of 10,000 households divided into three strata based on income levels:
- Low-income: 4,000 households
- Middle-income: 4,500 households
- High-income: 1,500 households
If I want to draw a sample of 1,000 households, the sample size for each stratum would be:
n_{\text{low}} = \left( \frac{4000}{10000} \right) \times 1000 = 400
n_{\text{middle}} = \left( \frac{4500}{10000} \right) \times 1000 = 450
This ensures that each income group is represented in the sample according to its proportion in the population.
Advantages of Stratified Sampling
- Improved Accuracy: By ensuring that each stratum is represented, stratified sampling reduces sampling error and provides more precise estimates.
- Efficient Resource Allocation: In auditing and risk management, stratified sampling allows me to focus resources on high-value or high-risk strata.
- Flexibility: I can tailor the sampling strategy to the specific characteristics of the population, making it suitable for a wide range of applications.
Disadvantages of Stratified Sampling
- Complexity: Stratified sampling requires detailed knowledge of the population and its subgroups, which can be time-consuming to obtain.
- Cost: Dividing the population into strata and sampling each stratum independently can be more expensive than simple random sampling.
- Risk of Misclassification: If the strata are not defined correctly, the results may be biased or misleading.
Practical Applications in Finance and Accounting
Auditing
In auditing, stratified sampling is often used to evaluate the accuracy of financial statements. For example, I might divide a company’s transactions into strata based on dollar amounts:
| Stratum | Transaction Range | Number of Transactions | Sample Size |
|---|---|---|---|
| High-value | > $100,000 | 200 | 50 |
| Medium-value | $10,000 – $100,000 | 1,000 | 100 |
| Low-value | < $10,000 | 10,000 | 50 |
By focusing on high-value transactions, I can identify potential errors or fraud more efficiently.
Risk Management
In risk management, stratified sampling helps me assess the credit risk of a loan portfolio. For instance, I might divide the loans into strata based on credit scores:
| Stratum | Credit Score Range | Number of Loans | Sample Size |
|---|---|---|---|
| Excellent | 750 – 850 | 500 | 100 |
| Good | 650 – 749 | 1,000 | 150 |
| Fair | 550 – 649 | 1,500 | 200 |
| Poor | 300 – 549 | 500 | 50 |
This allows me to identify trends and patterns in loan performance across different credit score ranges.
Market Research
In market research, stratified sampling helps me understand consumer behavior across different demographic groups. For example, I might divide the population into strata based on age:
| Stratum | Age Range | Population Size | Sample Size |
|---|---|---|---|
| Millennials | 25 – 40 | 5,000 | 500 |
| Gen X | 41 – 56 | 4,000 | 400 |
| Baby Boomers | 57 – 75 | 3,000 | 300 |
This ensures that each age group is represented in the sample, providing a more accurate picture of consumer preferences.
Step-by-Step Guide to Implementing Stratified Sampling
- Define the Population: Identify the population you want to study.
- Identify Strata: Divide the population into distinct subgroups based on relevant characteristics.
- Determine Sample Size: Calculate the sample size for each stratum using proportional allocation or another method.
- Draw the Sample: Randomly select samples from each stratum.
- Analyze the Data: Combine the results from each stratum to draw conclusions about the population.
Common Mistakes to Avoid
- Ignoring Key Strata: Failing to include important subgroups can lead to biased results.
- Overlapping Strata: Ensure that each individual belongs to only one stratum to avoid double-counting.
- Incorrect Sample Allocation: Allocating too few samples to a stratum can reduce the accuracy of your estimates.
Conclusion
Stratified sampling is a powerful tool that can help you make better decisions by providing accurate and representative data. Whether you’re auditing financial statements, managing risk, or conducting market research, stratified sampling ensures that every subgroup in your population is adequately represented. By understanding the math behind it and following best practices, you can unlock the full potential of this technique and gain deeper insights into your data.


