Understanding statistical measures like Standard Deviation is pivotal for learners in the realms of accounting and finance. This comprehensive guide aims to demystify Standard Deviation, providing a simplified explanation in easy-to-understand language while emphasizing its importance in financial analysis.
Deciphering Standard Deviation
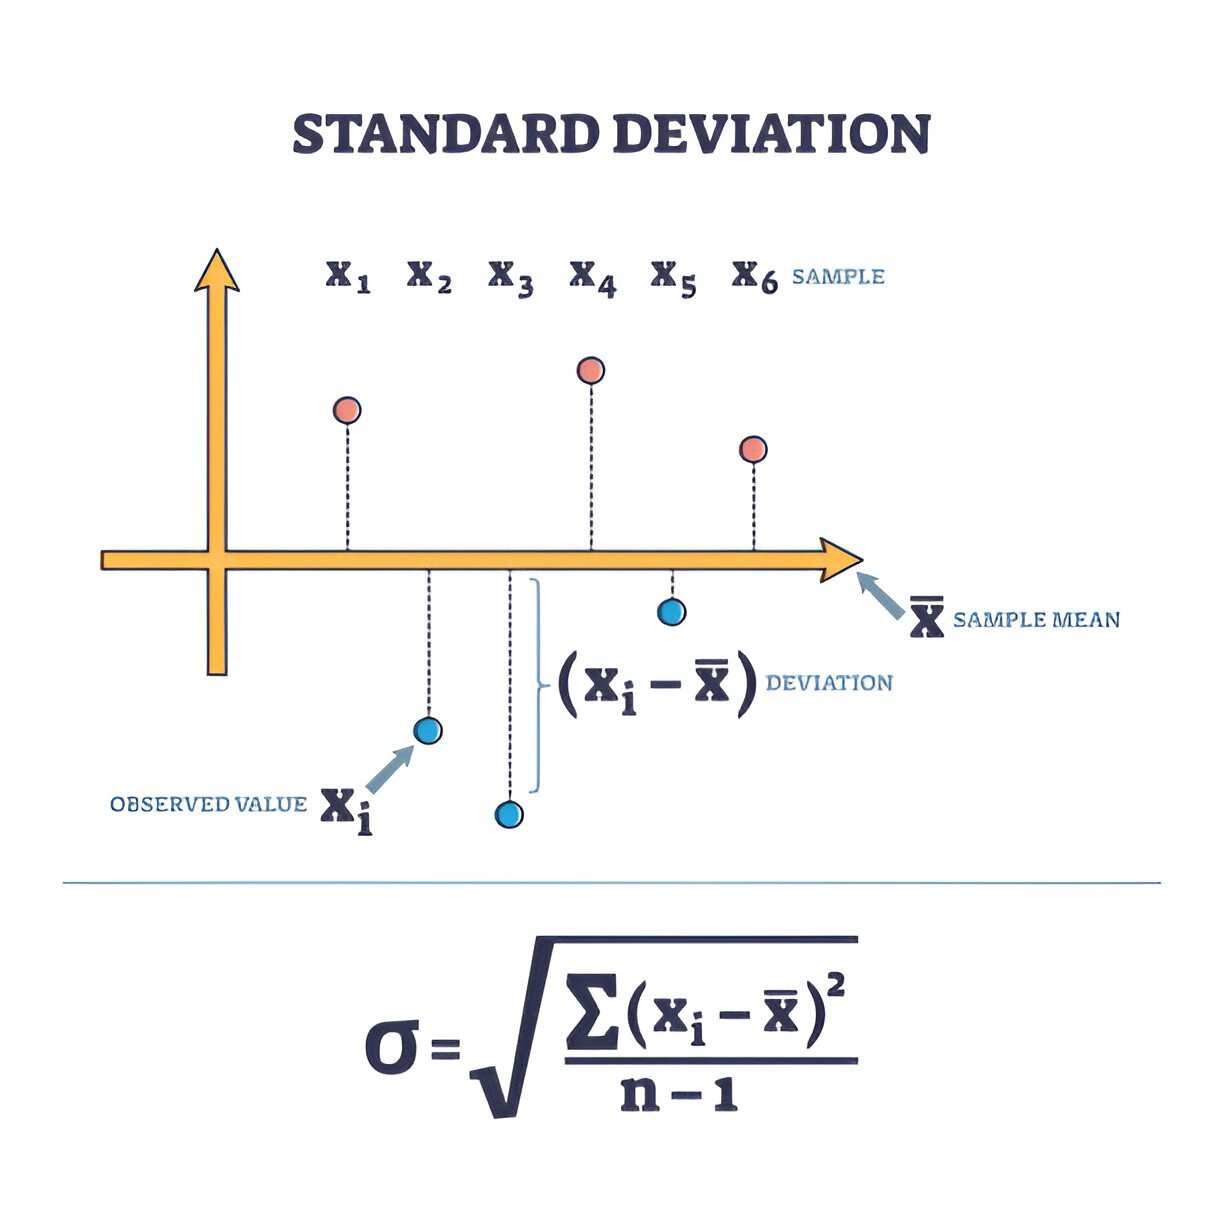
Standard Deviation is a statistical measure that quantifies the amount of variation or dispersion in a set of data. It essentially tells us how spread out the numbers in a dataset are from the mean (average). In the financial context, it’s a powerful tool for assessing the risk and volatility associated with investment returns.
Key Components of Standard Deviation
To grasp the concept fully, it’s essential to understand the key components:
Mean (Average): The sum of all values divided by the number of values in the dataset.
Individual Data Points: The specific values in the dataset.
Squared Differences: The squared value of the difference between each data point and the mean.
Variance: The average of the squared differences.
Square Root: The final step involves taking the square root of the variance to get the Standard Deviation.
How Standard Deviation Works: An Example
Let’s break down the calculation of Standard Deviation using a simple example:
Investment Returns Scenario: Consider a portfolio with annual returns over five years: 5%, 2%, 8%, -1%, and 6%. The steps include:
Calculate the Mean: (5 + 2 + 8 – 1 + 6) / 5 = 4%.
Squared Differences from the Mean: For each return, calculate the squared difference from the mean: (5 – 4)^2, (2 – 4)^2, etc.
Calculate Variance: Find the average of the squared differences.
Calculate Standard Deviation: Take the square root of the variance.
Real-World Implications
In finance and investment, Standard Deviation has profound implications:
Risk Assessment: Standard Deviation is a key indicator of investment risk. Higher Standard Deviation suggests greater volatility and risk.
Portfolio Diversification: Investors use Standard Deviation to assess how adding or removing assets from a portfolio can impact its overall risk.
Benefits of Standard Deviation
Quantifying Risk: It provides a numerical measure of the risk associated with a particular investment or portfolio.
Comparative Analysis: Standard Deviation allows investors to compare the volatility of different assets or investment strategies.
Challenges and Considerations
Assumption of Normal Distribution: Standard Deviation assumes a normal distribution of data, which may not always be the case in financial markets.
Doesn’t Capture All Risks: While it measures historical volatility, it may not capture unforeseen events or systemic risks.
Conclusion
For beginners in accounting and finance, understanding Standard Deviation is akin to having a financial compass that guides decision-making. By comprehending how this statistical measure quantifies risk and volatility, learners can navigate the complexities of financial analysis with more confidence. In the dynamic landscape of investments, the exploration of Standard Deviation underscores its significance as a fundamental tool for risk assessment and strategic decision-making.


