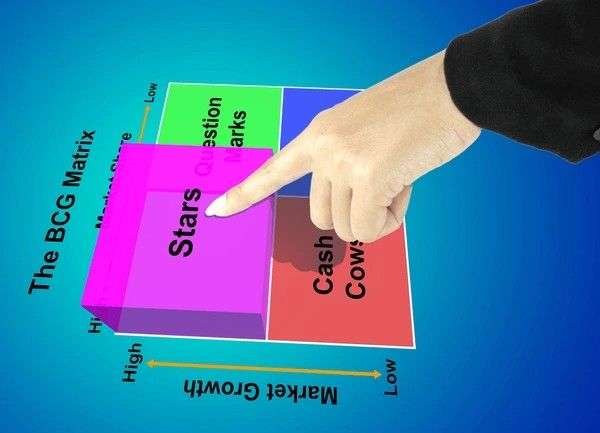
The Boston Matrix, also known as the Boston Consulting Group (BCG) Matrix, is a tool that helps businesses analyze their product lines or business units. It was created by the Boston Consulting Group in the 1970s and remains a popular method for strategic planning. This guide will explain the Boston Matrix, its components, and how it can be used with an example for better understanding.
Table of Contents
What is the Boston Matrix?
The Boston Matrix is a four-quadrant grid that helps businesses categorize their products or business units based on two key factors:
- Market Growth Rate: How fast the market for the product is growing.
- Market Share: The product’s share of the market compared to competitors.
The Four Quadrants of the Boston Matrix
1. Stars
Products or business units in the Stars quadrant have high market growth and high market share. These are the leading products in a fast-growing market. They generate significant revenue but also require substantial investment to maintain their position and support further growth.
Characteristics of Stars:
- High revenue generation
- High investment needed
- Potential to become Cash Cows when market growth slows
2. Cash Cows
Products in the Cash Cows quadrant have low market growth but high market share. These are established products that generate consistent revenue with little need for further investment. They are the “cash generators” for the business.
Characteristics of Cash Cows:
- Stable revenue generation
- Low investment required
- High profitability
3. Question Marks
Products in the Question Marks quadrant have high market growth but low market share. These are new or struggling products in a growing market. They require significant investment to increase market share and become Stars, or they may be discontinued if they fail to perform.
Characteristics of Question Marks:
- High potential but uncertain future
- Require substantial investment
- Can either become Stars or Dogs
4. Dogs
Products in the Dogs quadrant have low market growth and low market share. These are typically the least attractive products in the portfolio. They do not generate much revenue and may not be worth investing in.
Characteristics of Dogs:
- Low revenue generation
- Minimal investment required
- Candidates for discontinuation
How to Use the Boston Matrix
Step 1: Identify Products or Business Units
List all the products or business units in your portfolio that you want to analyze.
Step 2: Assess Market Growth and Market Share
Evaluate each product’s market growth rate and market share. This can be done using sales data, market research, and industry reports.
Step 3: Plot on the Boston Matrix
Place each product in the appropriate quadrant of the Boston Matrix based on its market growth rate and market share.
Step 4: Strategic Decisions
Use the placement of products in the matrix to make strategic decisions:
- Invest in Stars to maintain their leading position.
- Utilize Cash Cows for steady revenue and profit.
- Decide on Question Marks by either investing in them to increase market share or considering discontinuation.
- Consider discontinuing Dogs unless they serve a strategic purpose.
Example of the Boston Matrix
Let’s consider a fictional company, ABC Electronics, which sells four products: Smart TVs, Laptops, Mobile Phones, and MP3 Players.
- Smart TVs: High market growth and high market share (Stars)
- Laptops: Low market growth and high market share (Cash Cows)
- Mobile Phones: High market growth and low market share (Question Marks)
- MP3 Players: Low market growth and low market share (Dogs)
Strategic Decisions for ABC Electronics
- Smart TVs: Continue to invest heavily to maintain the leading position.
- Laptops: Use the profits from laptops to fund other areas of the business.
- Mobile Phones: Decide whether to invest more to increase market share or discontinue if unfeasible.
- MP3 Players: Consider discontinuing the product due to low performance and market demand.
Conclusion
The Boston Matrix is a valuable tool for businesses to analyze their product portfolio and make informed strategic decisions. By categorizing products into Stars, Cash Cows, Question Marks, and Dogs, companies can allocate resources effectively and maximize profitability. Understanding and using the Boston Matrix helps businesses navigate market dynamics and optimize their product strategy for long-term success.
References
- Boston Consulting Group. (n.d.). BCG Matrix.


