Introduction
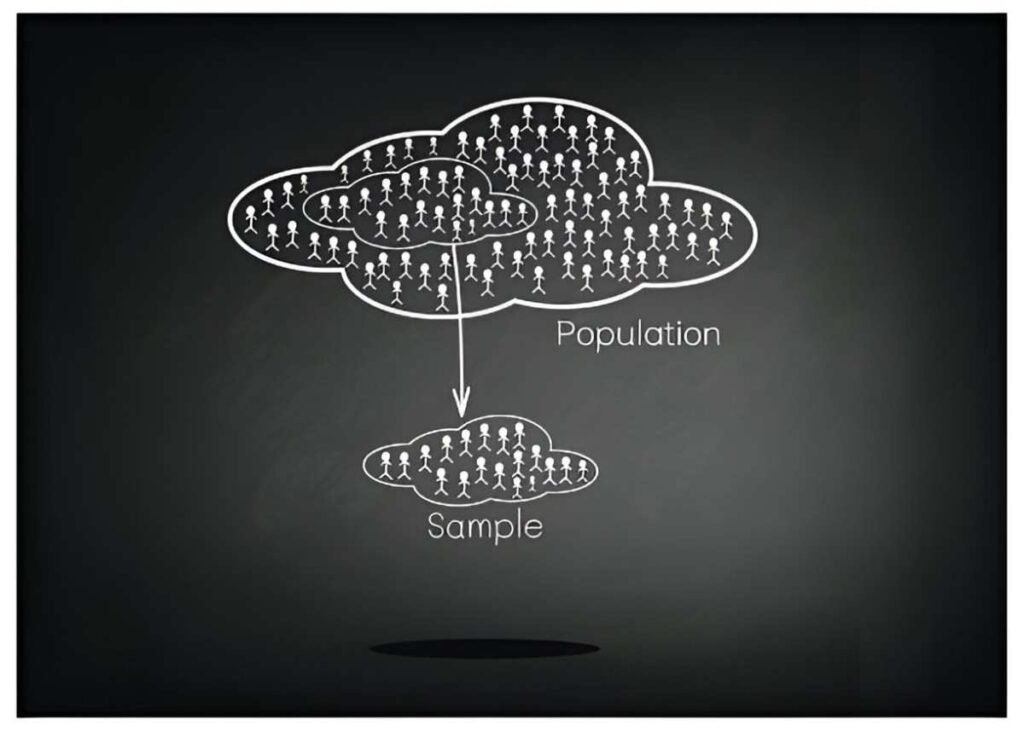
Probability sampling is an essential concept in research, statistics, and data analysis. It ensures that every member of a population has a known chance of being selected in a sample, reducing biases and increasing the reliability of findings. In this guide, I will explain probability sampling in simple terms, breaking down different techniques, their applications, and mathematical foundations.
Table of Contents
What is Probability Sampling?
Probability sampling is a sampling method where each unit in a population has a specific probability of being selected. This approach ensures representativeness, making it ideal for statistical analysis and inferential studies.
Key Principles
- Random Selection: Every individual has an equal or known chance of selection.
- Elimination of Bias: Since selection is random, researcher bias is minimized.
- Generalizability: Results can be extrapolated to the larger population.
Comparison with Non-Probability Sampling
| Feature | Probability Sampling | Non-Probability Sampling |
|---|---|---|
| Selection Method | Random | Non-random |
| Bias | Low | High |
| Representativeness | High | Low |
| Generalizability | Yes | No |
Types of Probability Sampling
1. Simple Random Sampling (SRS)
In simple random sampling, each individual in the population has an equal chance of being selected. This can be done using lottery methods or random number generators.
Example: Suppose a company has 1,000 employees, and I need to select 100 randomly. I assign each employee a number from 1 to 1,000 and use a random number generator to pick 100 numbers.
Mathematical Representation: If a population has size N and I need a sample of size n, the probability of selecting any specific individual is:
P = \frac{n}{N}2. Systematic Sampling
Systematic sampling selects every kth individual from a population after a random starting point.
Formula for Sampling Interval:
k = \frac{N}{n}Example: If I need to select 100 employees from 1,000, the sampling interval is:
k = \frac{1000}{100} = 10So, I randomly select a starting point and pick every 10th employee.
3. Stratified Sampling
Stratified sampling divides the population into homogeneous subgroups (strata) and selects samples from each group.
Formula for Proportional Allocation:
n_h = \frac{N_h}{N} \times nwhere N_h is the size of stratum h , and n_h is the sample size from that stratum.
Example: A company has 600 male and 400 female employees. If I need a sample of 100, I allocate:
- Males: \frac{600}{1000} \times 100 = 60
- Females: \frac{400}{1000} \times 100 = 40
4. Cluster Sampling
Cluster sampling divides the population into clusters and randomly selects entire clusters.
Example: A university has 50 departments, each with 200 students. If I randomly select 10 departments and survey all their students, this is cluster sampling.
5. Multistage Sampling
This involves multiple sampling techniques at different stages.
Example: I first divide a country into regions (clusters), then select cities using stratified sampling, and finally use simple random sampling to pick respondents.
Advantages and Disadvantages
| Type | Advantages | Disadvantages |
|---|---|---|
| Simple Random Sampling | Easy to implement, unbiased | May be impractical for large populations |
| Systematic Sampling | Simpler than SRS, evenly spread selection | Periodic patterns can introduce bias |
| Stratified Sampling | More representative, ensures subgroup inclusion | Requires knowledge of population characteristics |
| Cluster Sampling | Cost-effective, practical for large populations | Higher variance compared to SRS |
| Multistage Sampling | Flexible, suitable for large-scale studies | Complex to administer |
Applications of Probability Sampling
- Market Research: Ensures consumer surveys reflect diverse demographics.
- Epidemiology: Helps track disease prevalence.
- Election Polling: Estimates voter preferences accurately.
- Academic Research: Ensures unbiased data collection.
Probability Sampling vs. Census
A census studies every unit in a population, while probability sampling studies a subset.
| Feature | Probability Sampling | Census |
|---|---|---|
| Cost | Low | High |
| Time | Short | Long |
| Accuracy | High if done correctly | High but requires more effort |
Sample Size Calculation
To determine the required sample size, I use the following formula:
where:
- Z = Z-score based on confidence level
- p = Estimated proportion of population with a characteristic
- e = Margin of error
Example Calculation: If I want 95% confidence (Z = 1.96), expect 50% (p = 0.5) of respondents to have a trait, and allow a 5% error:
n = \frac{(1.96)^2 (0.5)(0.5)}{(0.05)^2} = 384Thus, I need a sample of 384 respondents.
Conclusion
Probability sampling is crucial for making valid inferences from data. By understanding different sampling techniques, I can select the most suitable method for any study, ensuring accuracy and reliability. Whether for business, healthcare, or social research, probability sampling provides a strong foundation for decision-making and analysis.


