Probability sampling forms the backbone of reliable research and data analysis. Whether I work in finance, marketing, or social sciences, the ability to draw meaningful conclusions hinges on selecting a sample that accurately represents the population. In this article, I explore probability sampling in depth—its principles, methods, advantages, and real-world applications—while ensuring the explanations remain accessible.
Table of Contents
What Is Probability Sampling?
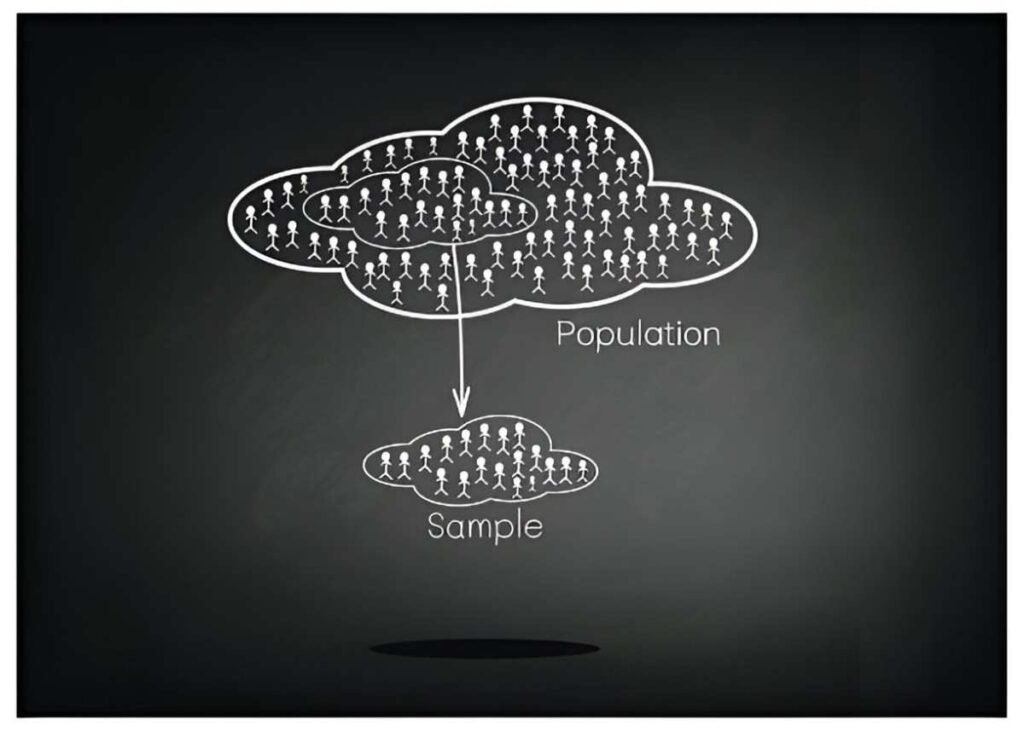
Probability sampling refers to a selection process where every member of a population has a known, non-zero chance of being included in the sample. This method eliminates bias, allowing me to generalize findings with confidence. Unlike non-probability sampling, which relies on convenience or judgment, probability sampling ensures statistical rigor.
Core Principles
- Random Selection – Every individual or element has an equal opportunity for selection.
- Known Probability – The likelihood of selection is quantifiable.
- Representativeness – The sample mirrors the population’s characteristics.
Types of Probability Sampling
I examine the most common probability sampling techniques below, each suited for different research scenarios.
1. Simple Random Sampling
The simplest form, where every possible sample of size n has an equal chance of selection. I can achieve this using random number generators or lottery methods.
Example:
Suppose I want to survey 100 employees from a company of 1,000. I assign each employee a number from 1 to 1,000 and use a random number generator to pick 100 unique numbers.
Advantages:
- Easy to implement.
- Minimizes selection bias.
Limitations:
- Requires a complete population list.
- May not capture subgroups effectively.
2. Stratified Sampling
Here, I divide the population into homogeneous subgroups (strata) and then randomly sample from each stratum. This ensures representation across key characteristics.
Example:
If I study income levels across the U.S., I might stratify by states to ensure all regions are included proportionally.
Formula for Stratified Sample Size:
n_h = \left( \frac{N_h}{N} \right) \times n
Where:
- n_h = sample size for stratum h
- N_h = population size of stratum h
- N = total population
- n = total sample size
Advantages:
- Improves precision for subgroups.
- Reduces sampling error.
Limitations:
- Requires prior knowledge of strata.
- Complex to administer.
3. Systematic Sampling
I select samples at fixed intervals from an ordered population list. The interval (k) is calculated as:
k = \frac{N}{n}Example:
For a population of 5,000 and a desired sample of 500, k = 10. I randomly pick a start point between 1 and 10, then select every 10th element.
Advantages:
- Simpler than simple random sampling.
- Evenly covers the population.
Limitations:
- Vulnerable to periodicity bias.
- Requires randomness in the population list.
4. Cluster Sampling
Instead of sampling individuals, I divide the population into clusters (e.g., geographic regions) and randomly select entire clusters.
Example:
If I study school performance across the U.S., I might randomly select 10 school districts and include all students within them.
Advantages:
- Cost-effective for large populations.
- Logistically simpler.
Limitations:
- Higher sampling error.
- Clusters must be heterogeneous internally.
5. Multistage Sampling
A combination of methods, often used in large-scale surveys. I might first use cluster sampling, then apply stratified or simple random sampling within clusters.
Example:
In a national health survey, I could:
- Randomly select states (clusters).
- Randomly select counties within states.
- Randomly select households within counties.
Advantages:
- Balances cost and accuracy.
- Flexible for complex populations.
Limitations:
- Requires careful planning.
- Potential for compounded errors.
Why Probability Sampling Matters
Statistical Validity
Probability sampling allows me to calculate confidence intervals and margins of error. For instance, the standard error (SE) of a sample mean is:
SE = \frac{\sigma}{\sqrt{n}}
Where:
- \sigma = population standard deviation
- n = sample size
This helps quantify uncertainty, a cornerstone of inferential statistics.
Generalizability
Findings from a probability sample can be extrapolated to the entire population. In contrast, non-probability samples (like convenience sampling) risk skewed results.
Regulatory Compliance
Many U.S. federal agencies, such as the Census Bureau and Bureau of Labor Statistics, mandate probability sampling for official surveys to ensure fairness and accuracy.
Challenges and Considerations
Cost and Logistics
Probability sampling can be expensive, especially for stratified or multistage designs. I must weigh precision against budget constraints.
Sampling Frame Errors
If my population list is incomplete (e.g., outdated census data), my sample may exclude key groups.
Non-Response Bias
Even with random selection, non-participation can distort results. For example, high-income earners might ignore financial surveys, leading to underestimates of wealth.
Probability Sampling in Finance and Economics
Market Research
Firms use stratified sampling to analyze consumer behavior across demographics. For instance, a bank may stratify customers by income brackets to assess loan demand.
Portfolio Analysis
Fund managers employ systematic sampling to select stocks from an index, ensuring a representative portfolio without analyzing every security.
Economic Surveys
The Federal Reserve uses multistage sampling for its Survey of Consumer Finances, capturing diverse household economic conditions.
Comparing Probability and Non-Probability Sampling
| Feature | Probability Sampling | Non-Probability Sampling |
|---|---|---|
| Selection Method | Random | Convenience/Judgment |
| Bias Risk | Low | High |
| Generalizability | High | Low |
| Cost | Higher | Lower |
| Use Case | Official statistics, research | Exploratory studies, pilot tests |
Practical Example: Calculating Sample Size
Suppose I want to estimate the average credit card debt among U.S. adults with a 95% confidence level and a margin of error of \$100. Assuming a population standard deviation (\sigma) of \$500, the required sample size (n) is:
n = \left( \frac{Z \cdot \sigma}{E} \right)^2Where:
- Z = 1.96 (for 95% confidence)
- E = \$100
Plugging in the values:
n = \left( \frac{1.96 \times 500}{100} \right)^2 = 96.04I round up to 97 respondents.
Conclusion
Probability sampling remains indispensable for credible research. By ensuring randomness and measurability, I minimize bias and enhance the reliability of my findings. While challenges like cost and logistics exist, the benefits—statistical validity, generalizability, and regulatory compliance—make it a cornerstone of data-driven decision-making. Whether I analyze financial trends or social behaviors, mastering these techniques empowers me to derive insights that truly reflect the world around me.


