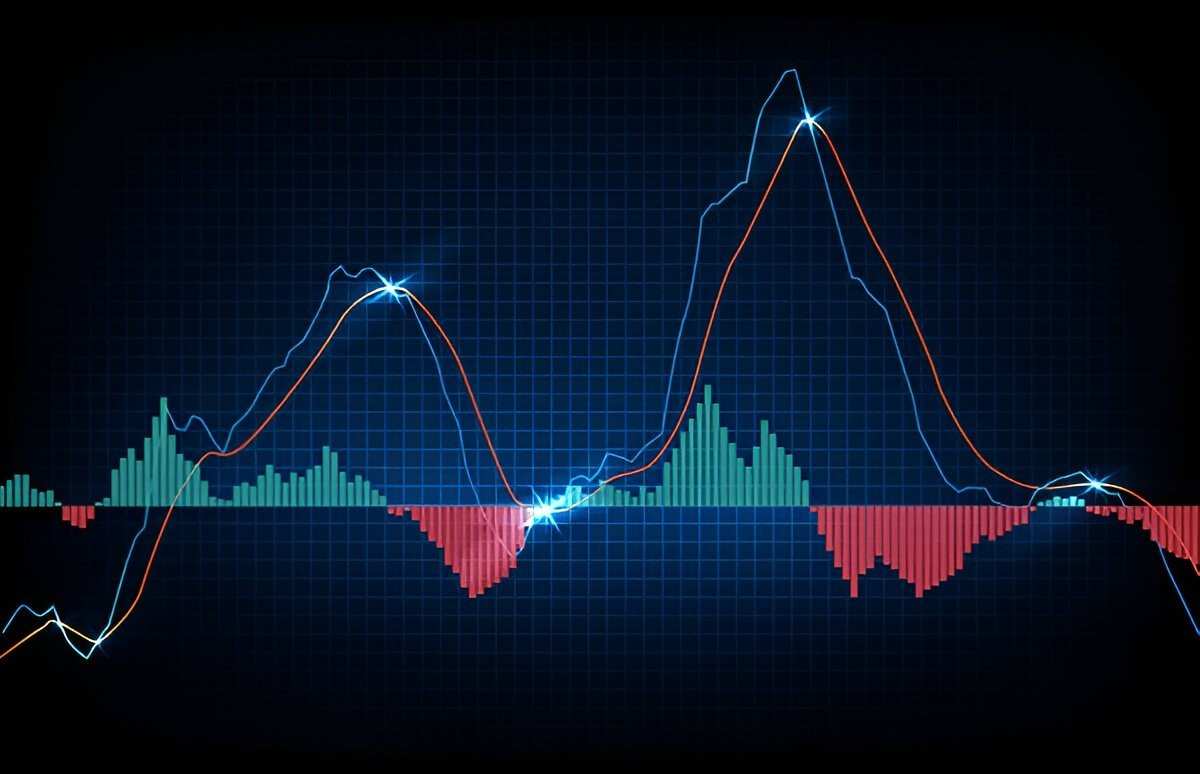
A divergence indicator is a technical analysis tool used by traders to identify potential reversals or changes in the trend of a financial asset’s price. It compares price movements with related indicators, such as oscillators or moving averages, to detect discrepancies that may signal shifts in market momentum. Divergence indicators help traders anticipate price movements and make informed trading decisions based on divergence patterns.
Table of Contents
How Divergence Indicators Work
Divergence indicators analyze price movements and corresponding indicators to identify two main types of divergences:
- Regular Divergence: Occurs when the price trend and the indicator trend move in opposite directions. This suggests a potential reversal in the current price trend.
- Hidden Divergence: Occurs when the price trend and the indicator trend move in the same direction, but at different rates. This indicates a continuation of the current price trend.
Types of Divergence Indicators
- MACD (Moving Average Convergence Divergence): A popular indicator that compares two moving averages of an asset’s price to identify changes in momentum and potential buy or sell signals.
- RSI (Relative Strength Index): Measures the speed and change of price movements to determine overbought or oversold conditions. Divergence between RSI and price movements can signal potential reversals.
- Stochastic Oscillator: Evaluates the closing price relative to a price range over a specified period. Divergence between stochastic oscillator readings and price movements can indicate shifts in market sentiment.
Example of Divergence Indicator
Let’s illustrate with a hypothetical example using the MACD indicator:
- Asset XYZ: XYZ stock has been trending upward for several weeks, reaching new highs.
- MACD Analysis: Traders observe that while XYZ stock continues to climb, the MACD indicator shows decreasing highs, indicating a divergence between price and momentum.
- Interpretation: This bearish regular divergence suggests that despite the upward price movement, momentum is weakening, potentially signaling a reversal or correction in XYZ stock’s price.
- Trading Decision: Based on the divergence indicator signal, traders may consider taking profits on long positions or initiating short positions to capitalize on the anticipated price reversal.
Benefits of Using Divergence Indicators
- Early Warning Signals: Divergence indicators provide early signals of potential changes in price trends, allowing traders to enter or exit positions before the trend reversal becomes evident.
- Confirmation: When supported by other technical analysis tools and market indicators, divergence signals can strengthen the confidence in trading decisions.
- Versatility: Divergence indicators can be applied to various timeframes and asset classes, enhancing their utility for traders across different markets.
Limitations of Divergence Indicators
- False Signals: Divergence indicators may occasionally produce false signals, especially in volatile or ranging markets, leading to potential trading losses.
- Subjectivity: Interpretation of divergence indicators requires skill and experience, as different traders may analyze the same divergence pattern differently.
- Market Conditions: Divergence indicators perform best in trending markets and may be less effective in choppy or sideways markets where price movements are erratic.
Using Divergence Indicators Effectively
- Combine with Other Tools: Incorporate divergence indicators with other technical analysis tools, such as trendlines, support/resistance levels, and volume analysis, to validate signals.
- Practice and Backtesting: Practice using divergence indicators on historical data to refine trading strategies and understand their performance in different market conditions.
Conclusion
Divergence indicators are valuable tools in technical analysis that help traders identify potential reversals or continuations in price trends based on discrepancies between price movements and related indicators. By detecting regular and hidden divergences, traders can anticipate market movements and make informed decisions to optimize trading outcomes. While divergence indicators offer valuable insights into market momentum and trend changes, traders should exercise caution, verify signals with complementary analysis, and adapt strategies to suit prevailing market conditions. Understanding and mastering divergence indicators empower traders to navigate financial markets with greater confidence and precision, enhancing their ability to capitalize on profitable trading opportunities.


