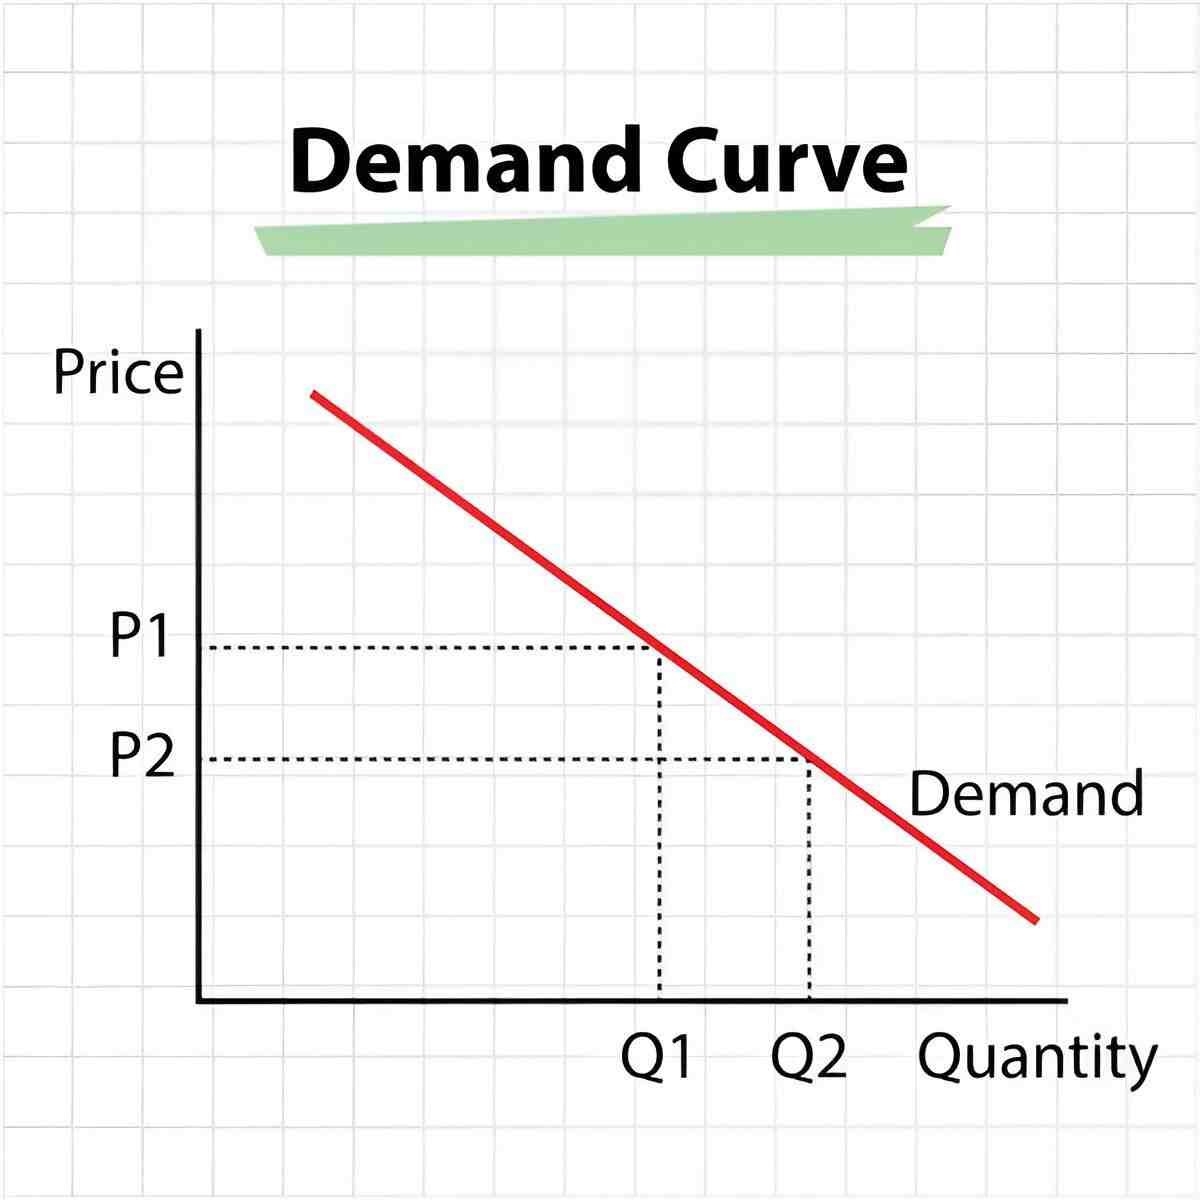
A demand curve illustrates the relationship between the price of a good or service and the quantity demanded by consumers. It is a fundamental concept in economics that helps analyze how changes in price affect consumer behavior.
Table of Contents
Key Characteristics of a Demand Curve
- Downward Sloping: Typically, demand curves slope downwards from left to right, indicating that as the price of a product decreases, the quantity demanded increases, and vice versa.
- Ceteris Paribus Assumption: The demand curve assumes that all other factors affecting demand remain constant, including consumer incomes, prices of related goods, and preferences.
- Graphical Representation: It is graphically represented with price on the vertical axis (y-axis) and quantity demanded on the horizontal axis (x-axis).
How Demand Curves Work
Economic Principles
- Law of Demand: According to the law of demand, there is an inverse relationship between price and quantity demanded. When the price of a good decreases, consumers tend to buy more of it, and when the price increases, they buy less, assuming other factors remain unchanged.
- Individual and Market Demand: Demand curves can represent the behavior of an individual consumer or aggregate demand in a market.
Example of a Demand Curve
Demand for Coffee
- Scenario: Suppose the price of coffee per cup decreases from $3 to $2. Based on the demand curve, consumers may increase their quantity demanded from 200 cups to 300 cups per day.
Factors Influencing Demand Curves
Shifts in Demand
- Income Changes: An increase in consumer income may shift the demand curve for luxury goods to the right, indicating higher demand at all price levels.
- Substitute and Complementary Goods: Changes in the prices of substitute or complementary goods can influence the shape and position of the demand curve.
Elasticity of Demand
- Price Elasticity: The steepness of the demand curve reflects the price elasticity of demand. A steep curve indicates inelastic demand (quantity demanded changes less than proportionally to price), while a flatter curve indicates elastic demand (quantity demanded changes more than proportionally to price).
Applications and Analysis
Market Equilibrium
- Intersection of Supply and Demand: The equilibrium price and quantity in a market are determined by the intersection of the supply curve and the demand curve. This point reflects where quantity supplied equals quantity demanded.
Policy Implications
- Taxation and Subsidies: Governments use demand curves to analyze the impact of taxes or subsidies on consumer behavior and market outcomes.
Critiques and Limitations
Assumptions and Real-World Application
- Simplifying Assumptions: The ceteris paribus assumption may not hold in real-world scenarios where multiple factors simultaneously affect demand.
- Dynamic Markets: Demand curves may shift rapidly due to changes in consumer tastes, technology, or external shocks, challenging the static nature of the demand curve model.
Conclusion
Understanding the demand curve is crucial for comprehending consumer behavior and market dynamics in economics. It provides insights into how consumers respond to changes in prices and other economic variables. By analyzing demand curves, economists and businesses can make informed decisions regarding pricing strategies, production levels, and market interventions. Despite its theoretical underpinnings and assumptions, the demand curve remains a fundamental tool in economic analysis, offering valuable insights into the functioning of markets and the behavior of consumers.


