As someone deeply immersed in the world of finance and accounting, I’ve come to appreciate the power of data-driven decision-making. One of the most critical tools in my arsenal is proportionate stratified sampling, a statistical technique that ensures accurate and representative data analysis. In this article, I’ll guide you through the intricacies of this method, its applications in finance, and how you can master it to enhance your analytical skills. Whether you’re a student, a budding financial analyst, or a seasoned professional, understanding proportionate stratified sampling is essential for making informed decisions in a data-rich world.
Table of Contents
What Is Proportionate Stratified Sampling?
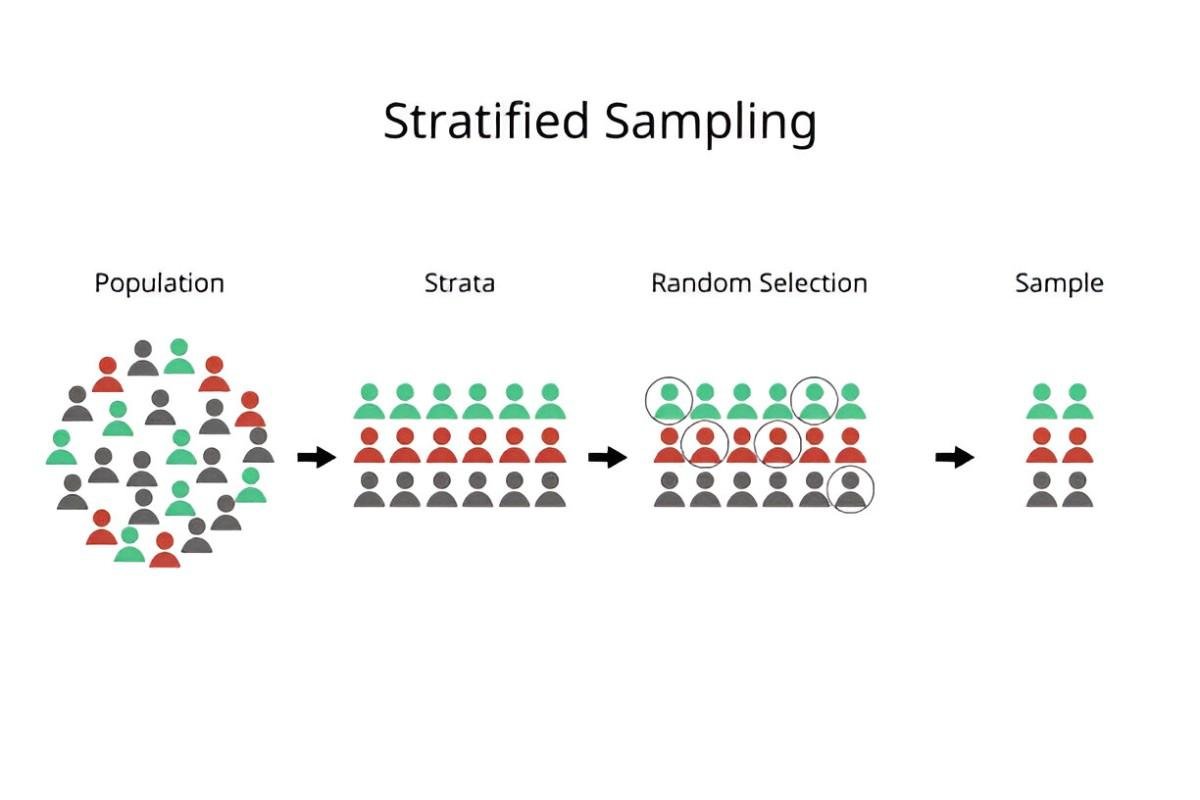
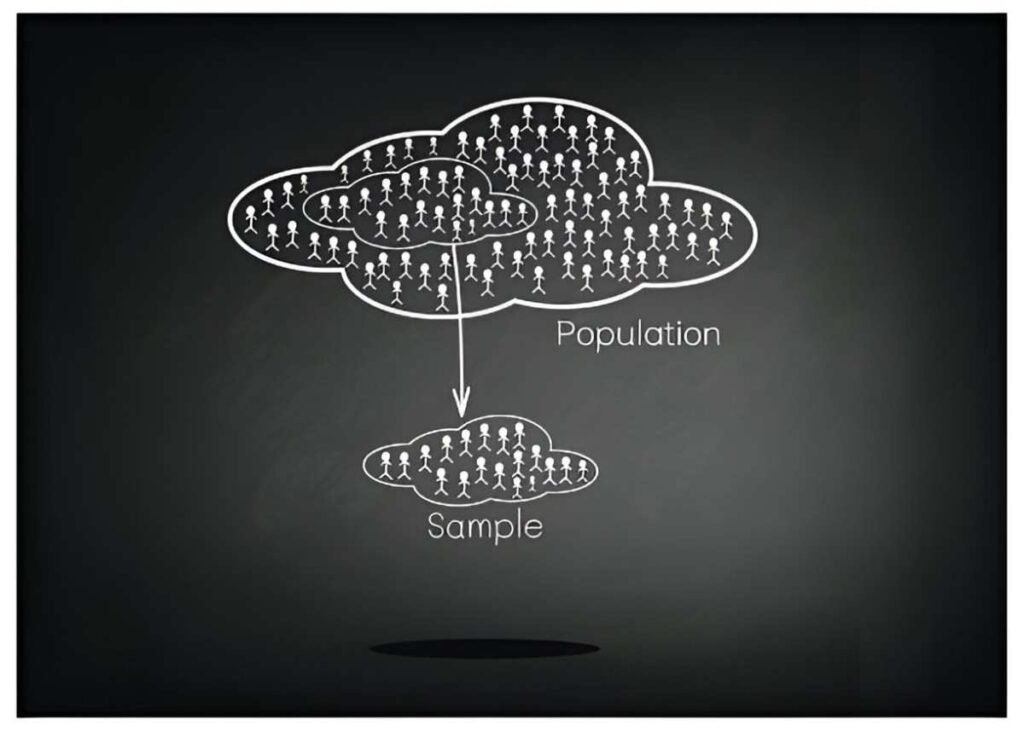
Proportionate stratified sampling is a statistical method used to divide a population into distinct subgroups, or strata, based on specific characteristics. Each stratum is then sampled in proportion to its size in the population. This approach ensures that every subgroup is adequately represented, leading to more accurate and reliable results.
For example, imagine you’re analyzing the financial performance of companies in the S&P 500. The population (S&P 500) can be stratified by industry sectors such as technology, healthcare, and energy. If the technology sector makes up 25% of the S&P 500, then 25% of your sample will come from this sector. This proportionality ensures that your sample reflects the true composition of the population.
Why Is Proportionate Stratified Sampling Important in Finance?
In finance, data is often heterogeneous, meaning it varies significantly across different segments. For instance, income levels, investment behaviors, and risk appetites differ widely among demographic groups. Without proper stratification, your analysis might overlook critical nuances, leading to biased conclusions.
Proportionate stratified sampling addresses this issue by ensuring that each subgroup is represented in the sample. This is particularly useful in financial applications such as:
- Portfolio Analysis: Stratifying investments by asset class or risk level to assess performance accurately.
- Market Research: Understanding consumer behavior across different income brackets or geographic regions.
- Risk Assessment: Evaluating credit risk by stratifying borrowers based on credit scores or loan types.
By using this method, I’ve been able to uncover insights that would have been missed with simpler sampling techniques.
The Mathematics Behind Proportionate Stratified Sampling
To truly master this technique, you need to understand the underlying mathematics. Let’s break it down step by step.
Step 1: Define the Population and Strata
Suppose the population size is N, and it is divided into k strata. The size of each stratum is denoted as N_1, N_2, \dots, N_k, where:
N = N_1 + N_2 + \dots + N_kStep 2: Determine the Sample Size
The total sample size is n. In proportionate stratified sampling, the sample size for each stratum (n_i) is proportional to the size of the stratum in the population:
n_i = \left( \frac{N_i}{N} \right) \times nFor example, if the population size is 10,000 and the sample size is 1,000, and one stratum makes up 30% of the population, then:
n_i = \left( \frac{3,000}{10,000} \right) \times 1,000 = 300Step 3: Calculate the Mean and Variance
The mean (\bar{x}) and variance (s^2) of the sample can be calculated as follows:
\bar{x} = \sum_{i=1}^k \left( \frac{N_i}{N} \right) \bar{x}_i s^2 = \sum_{i=1}^k \left( \frac{N_i}{N} \right)^2 \left( \frac{s_i^2}{n_i} \right)Where \bar{x}_i and s_i^2 are the mean and variance of the i^{th} stratum, respectively.
Example Calculation
Let’s say we’re analyzing the average return on investment (ROI) for three strata in a portfolio:
| Stratum | Population Size (N_i) | Sample Size (n_i) | Mean ROI (\bar{x}_i) | Variance (s_i^2) |
|---|---|---|---|---|
| A | 4,000 | 400 | 8% | 4 |
| B | 3,000 | 300 | 6% | 3 |
| C | 3,000 | 300 | 10% | 5 |
Using the formula for the mean:
\bar{x} = \left( \frac{4,000}{10,000} \times 8 \right) + \left( \frac{3,000}{10,000} \times 6 \right) + \left( \frac{3,000}{10,000} \times 10 \right) = 7.8\%The variance is calculated as:
s^2 = \left( \frac{4,000}{10,000} \right)^2 \left( \frac{4}{400} \right) + \left( \frac{3,000}{10,000} \right)^2 \left( \frac{3}{300} \right) + \left( \frac{3,000}{10,000} \right)^2 \left( \frac{5}{300} \right) = 0.016This example illustrates how proportionate stratified sampling provides a weighted average that reflects the population’s true composition.
Advantages of Proportionate Stratified Sampling
- Improved Accuracy: By ensuring each stratum is represented, the sample more accurately reflects the population.
- Efficient Resource Allocation: Sampling is focused on relevant subgroups, reducing unnecessary data collection.
- Enhanced Comparability: Stratification allows for meaningful comparisons between subgroups.
Limitations to Consider
While proportionate stratified sampling is powerful, it’s not without limitations:
- Requires Prior Knowledge: You need detailed information about the population to define strata effectively.
- Complexity: The method involves more steps than simple random sampling, which can be time-consuming.
- Potential for Error: Incorrect stratification can lead to biased results.
Practical Applications in Finance
1. Portfolio Management
In portfolio management, stratified sampling helps analyze the performance of different asset classes. For instance, if you’re managing a diversified portfolio, you can stratify investments by risk level (low, medium, high) and assess returns proportionately.
2. Credit Risk Analysis
Banks and financial institutions use stratified sampling to evaluate credit risk. By stratifying borrowers based on credit scores, they can estimate default rates more accurately.
3. Market Research
Companies use this method to understand consumer behavior. For example, a firm might stratify customers by income levels to analyze purchasing patterns.
Comparing Proportionate and Disproportionate Stratified Sampling
While proportionate stratified sampling ensures each stratum is represented according to its size, disproportionate stratified sampling allocates samples based on other criteria, such as variability within strata. The choice between the two depends on your research objectives.
| Feature | Proportionate Sampling | Disproportionate Sampling |
|---|---|---|
| Representation | Reflects population proportions | May over/under-represent strata |
| Complexity | Simpler | More complex |
| Use Case | General analysis | Focused analysis on specific strata |
Common Mistakes to Avoid
- Incorrect Stratification: Ensure strata are mutually exclusive and collectively exhaustive.
- Ignoring Variability: High variability within strata can affect accuracy. Consider disproportionate sampling if variability differs significantly.
- Small Sample Sizes: Avoid sampling too few units from any stratum, as this can lead to unreliable results.
Tools and Software for Proportionate Stratified Sampling
Several tools can simplify the process:
- Excel: Basic calculations can be done using Excel formulas.
- R: The
samplingpackage in R is ideal for stratified sampling. - Python: Libraries like
pandasandnumpyfacilitate stratified sampling in Python.
Conclusion
Mastering proportionate stratified sampling is a valuable skill for anyone in finance. It enhances the accuracy and reliability of your analyses, enabling you to make better-informed decisions. By understanding the mathematics, advantages, and practical applications, you can leverage this technique to uncover insights that drive success.


