As someone who has spent years analyzing financial data, I understand how crucial credit scores are in the U.S. Whether you’re applying for a mortgage, car loan, or even a rental agreement, lenders rely on these scores to gauge your creditworthiness. But how exactly are these numbers calculated? In this deep dive, I’ll break down the two dominant credit scoring models—FICO® and VantageScore®—and explain the mathematical and socioeconomic factors shaping them.
Table of Contents
The Importance of Credit Scores in the U.S.
Credit scores influence nearly every financial decision. A high score can mean lower interest rates, better loan terms, and even job opportunities. A low score can lead to rejections or higher borrowing costs. Given that 90% of top lenders use FICO® scores and VantageScore® is gaining traction, understanding their calculations is essential.
The Two Major Credit Scoring Models
1. FICO® Score
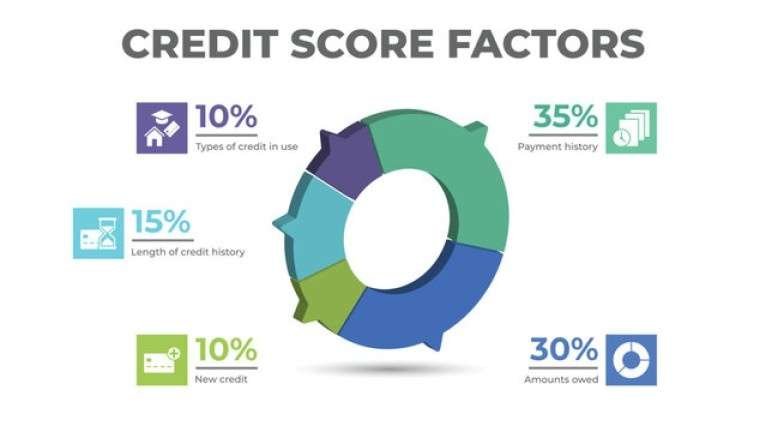
Developed by the Fair Isaac Corporation, the FICO® score has been the industry standard since 1989. The latest version, FICO® Score 10, uses five weighted categories:
- Payment History (35%) – Whether you pay bills on time.
- Amounts Owed (30%) – Credit utilization ratio.
- Length of Credit History (15%) – Average age of accounts.
- Credit Mix (10%) – Diversity of credit types (mortgages, credit cards, etc.).
- New Credit (10%) – Recent credit inquiries and new accounts.
2. VantageScore®
Created by the three major credit bureaus (Experian, Equifax, TransUnion), VantageScore® 4.0 uses a slightly different approach:
- Payment History (40%) – Similar to FICO®, but slightly more influential.
- Age & Type of Credit (21%) – Combines length and mix of credit.
- Credit Utilization (20%) – Balances relative to limits.
- Total Balances (11%) – Overall debt levels.
- Recent Credit (5%) – New applications and accounts.
- Available Credit (3%) – Unused credit limits.
Mathematical Breakdown of Credit Score Calculations
FICO® Score Formula (Simplified)
While the exact algorithm is proprietary, we can approximate the calculation:
\text{FICO Score} = (0.35 \times \text{Payment History}) + (0.30 \times \text{Credit Utilization}) + (0.15 \times \text{Credit Age}) + (0.10 \times \text{Credit Mix}) + (0.10 \times \text{New Credit})Example Calculation:
- Payment History: 95% (no late payments)
- Credit Utilization: 20% (low debt relative to limits)
- Credit Age: 7 years (long history)
- Credit Mix: 80% (multiple account types)
- New Credit: 70% (few recent inquiries)
This would roughly translate to a score of 827 (since FICO® scores range from 300–850).
VantageScore® Formula (Simplified)
VantageScore® uses a more granular breakdown:
\text{VantageScore} = (0.40 \times \text{Payment History}) + (0.21 \times \text{Credit Age \& Mix}) + (0.20 \times \text{Utilization}) + (0.11 \times \text{Total Balances}) + (0.05 \times \text{Recent Credit}) + (0.03 \times \text{Available Credit})Example Calculation:
- Payment History: 90%
- Credit Age & Mix: 85%
- Utilization: 75%
- Total Balances: 60%
- Recent Credit: 50%
- Available Credit: 80%
This would roughly translate to a score of 803 (VantageScore® also ranges from 300–850).
Key Differences Between FICO® and VantageScore®
| Factor | FICO® Score | VantageScore® |
|---|---|---|
| Payment History Weight | 35% | 40% |
| Credit Utilization | 30% | 20% |
| Handles Thin Files | Less Flexible | More Inclusive |
| Score Range | 300–850 | 300–850 |
| Recent Credit Impact | Moderate | Low |
Why These Differences Matter
- Thin Credit Files: VantageScore® can generate scores for people with limited credit history, while FICO® often requires at least six months of activity.
- Medical Debt: VantageScore® 4.0 ignores paid medical collections, whereas FICO® still considers them.
- Trended Data: FICO® Score 10T uses trended data (24-month payment patterns), while VantageScore® focuses more on current balances.
How Socioeconomic Factors Influence Credit Scores
Credit scores aren’t just about math—they reflect broader financial behaviors shaped by socioeconomic conditions.
- Income Inequality & Credit Access
- Lower-income individuals may rely more on subprime credit, leading to higher utilization and lower scores.
- Wealthier borrowers often have longer credit histories and lower utilization.
- Racial Disparities
- Studies show that Black and Hispanic Americans have lower average credit scores due to systemic barriers in credit access.
- Age & Generational Differences
- Younger consumers often have lower scores due to shorter credit histories.
- Older generations may have higher scores but could suffer from outdated scoring models.
Improving Your Credit Score: Practical Steps
- Pay Bills on Time (Most impactful for both models)
- Keep Credit Utilization Below 30% (Ideally under 10% for optimal scores)
- Avoid Opening Too Many New Accounts (Hard inquiries hurt temporarily)
- Maintain a Diverse Credit Mix (Installment loans + revolving credit)
- Monitor Credit Reports for Errors (Dispute inaccuracies promptly)
Final Thoughts
Credit scores are complex but not incomprehensible. By understanding how FICO® and VantageScore® weigh different factors, you can take strategic steps to improve your financial standing. Whether you’re rebuilding credit or optimizing for a mortgage, the key lies in disciplined financial behavior and leveraging the right scoring model for your situation.


