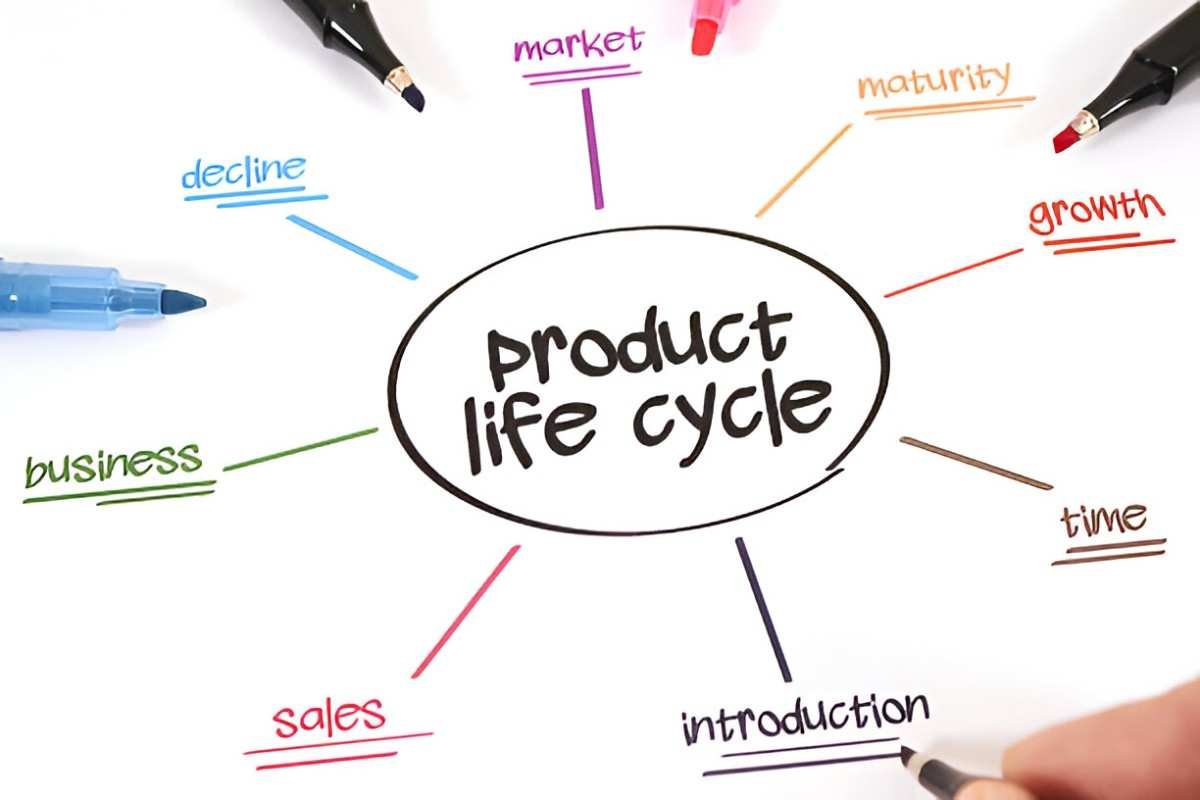
Understanding the product life cycle (PLC) is crucial for anyone involved in business, finance, or marketing. Whether you’re launching a startup, managing an established brand, or analyzing investment opportunities, grasping how products evolve over time helps you make smarter decisions. In this guide, I break down the concept, its stages, financial implications, and real-world applications—all in plain English.
Table of Contents
What Is the Product Life Cycle?
The product life cycle describes the journey of a product from its introduction to its eventual decline. Just like living organisms, products go through distinct phases—each with unique challenges and opportunities. The four primary stages are:
- Introduction
- Growth
- Maturity
- Decline
While not all products follow this exact path, the PLC framework provides a useful lens for forecasting sales, profitability, and strategic adjustments.
Why the Product Life Cycle Matters
I’ve seen businesses fail because they misjudged where their product stood in its life cycle. A company might overspend on marketing for a declining product or underinvest in innovation during growth. By recognizing the stage, you can allocate resources wisely, adjust pricing, and stay ahead of competitors.
The Four Stages of the Product Life Cycle
1. Introduction Stage
When a product first hits the market, sales are low, and costs are high. Companies spend heavily on research, development, and marketing to build awareness. Profits are usually negative.
Example: Tesla’s early days with the Roadster. The electric car market was niche, and Tesla had to educate consumers while dealing with high production costs.
Financial Consideration:
The initial cash flow can be modeled as:
Since sales are minimal, the focus is on establishing demand rather than profitability.
2. Growth Stage
Demand accelerates, sales rise, and competitors take notice. Economies of scale kick in, reducing per-unit costs. Profits start climbing.
Example: The smartphone boom post-iPhone launch. Companies like Samsung entered the market, driving innovation and adoption.
Key Metrics:
- Sales Growth Rate: \frac{Sales_{t} - Sales_{t-1}}{Sales_{t-1}} \times 100
- Market Penetration: \frac{Current\ Customers}{Total\ Market\ Size} \times 100
Strategy: Businesses often reinvest profits into expansion, distribution, and product improvements.
3. Maturity Stage
Sales peak, competition intensifies, and price wars may erupt. Marketing shifts from acquiring new customers to retaining existing ones.
Example: Coca-Cola. The soda market is saturated, so Coca-Cola focuses on brand loyalty and diversification (e.g., Coke Zero).
Profitability Equation:
Profit = (Units\ Sold \times Price) - (Fixed\ Costs + Variable\ Costs)Since margins shrink, companies may:
- Cut costs
- Differentiate through branding
- Explore new markets
4. Decline Stage
Sales drop due to market saturation, technological obsolescence, or shifting consumer preferences. Companies must decide whether to discontinue, reinvent, or milk the product.
Example: DVD players. With streaming dominance, sales have plummeted.
Exit Strategy Calculations:
If continuing production is unprofitable:
Firms may liquidate inventory or pivot to newer products.
Financial Implications Across the PLC
Each stage impacts cash flow, valuation, and investment decisions. Below is a comparison of key financial metrics:
| Stage | Revenue Trend | Profitability | Cash Flow | Investment Needed |
|---|---|---|---|---|
| Introduction | Low, rising | Negative | Negative | High (R&D, marketing) |
| Growth | Rapid increase | Rising | Improving | Moderate (expansion) |
| Maturity | Stable/declining | Peaking | Positive but flat | Low (optimization) |
| Decline | Falling | Shrinking | Negative | Minimal/exit |
Calculating Product Viability
To assess whether to continue a product, I use the Discounted Cash Flow (DCF) model:
DCF = \sum_{t=1}^{n} \frac{CF_t}{(1 + r)^t}Where:
- CF_t = Cash flow in year t
- r = Discount rate
If the DCF falls below the product’s maintenance cost, discontinuation may be the best option.
Real-World Applications
Case Study: Apple’s iPhone
- Introduction (2007): High hype, limited sales.
- Growth (2010-2015): Explosive demand, market expansion.
- Maturity (2016-present): Slowing growth, incremental updates.
- Decline (Future): Not yet, but eventual saturation is inevitable.
Apple combats decline through ecosystem lock-in (services like iCloud) and new product lines (e.g., AR glasses).
Small Business Perspective
A local bakery launching artisanal sourdough:
- Intro: Free samples, social media ads.
- Growth: Wholesale deals with cafes.
- Maturity: Loyalty programs.
- Decline: Shift to gluten-free trends.
Common Misconceptions
- “All products follow the PLC.” Some, like diamonds or milk, have near-infinite maturity.
- “Decline means failure.” Not always—sometimes it’s natural market evolution.
Key Takeaways
- Identify the stage to tailor strategies.
- Monitor financial metrics to avoid sunk costs.
- Innovate early to extend maturity.
By mastering the product life cycle, I’ve helped businesses avoid costly mistakes and capitalize on opportunities. Whether you’re an entrepreneur, investor, or student, this framework is indispensable for long-term success.


