Data analysis forms the backbone of decision-making in finance, accounting, and many other fields. While much attention goes into minimizing sampling errors, non-sampling errors often lurk in the shadows, distorting results without warning. I’ve seen projects derailed because analysts overlooked these hidden pitfalls. In this guide, I’ll break down non-sampling errors—what they are, why they matter, and how to mitigate them—using plain language, practical examples, and mathematical clarity.
Table of Contents
What Are Non-Sampling Errors?
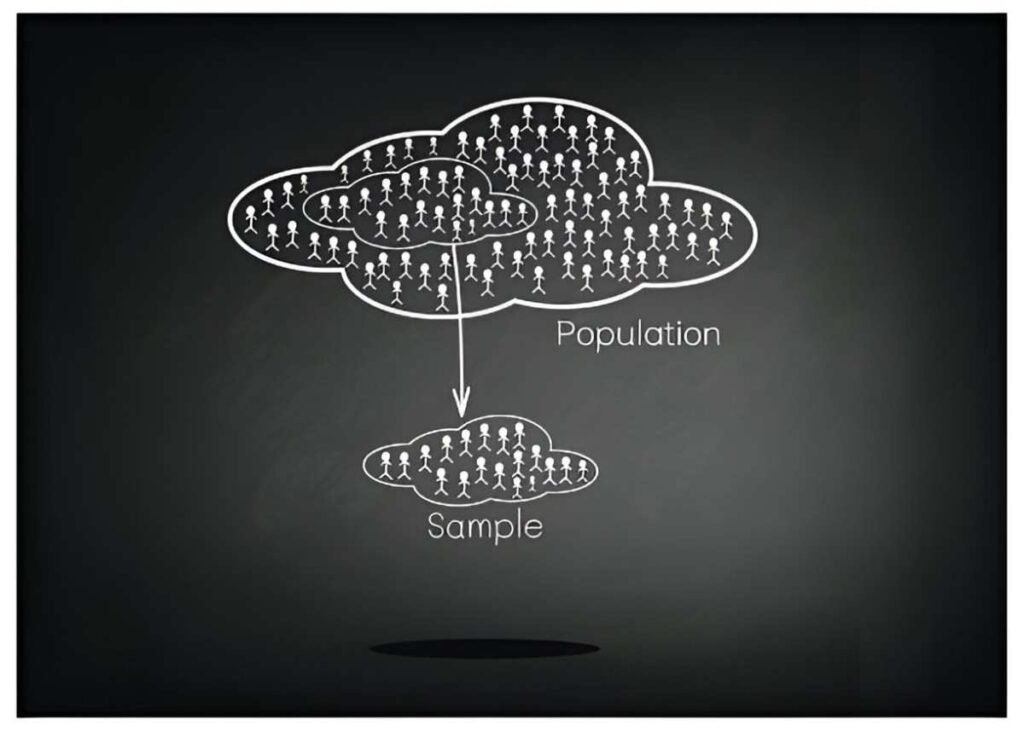
Sampling errors arise because we analyze a subset of data rather than the entire population. Non-sampling errors, however, occur due to flaws in data collection, processing, or interpretation—regardless of sample size. They can bias results even in a full population census.
Key Types of Non-Sampling Errors
- Measurement Errors – Flaws in data recording.
- Coverage Errors – Missing part of the target population.
- Non-Response Errors – Data gaps due to lack of participation.
- Processing Errors – Mistakes in data entry or coding.
- Specification Errors – Using incorrect models or assumptions.
Each type introduces distortions, sometimes compounding into severe inaccuracies.
Measurement Errors: The Silent Distorters
Measurement errors happen when recorded values deviate from true values. In finance, if a company misreports revenue due to faulty accounting software, all subsequent analyses inherit that flaw.
Example: Inflation Adjustments Gone Wrong
Suppose I analyze wage growth over a decade. If inflation adjustments use incorrect Consumer Price Index (CPI) weights, my real wage calculations will be off. The error propagates as:
Real\ Wage = \frac{Nominal\ Wage}{CPI_{incorrect}} \times 100A 5% understatement in CPI inflates real wage growth artificially.
Coverage Errors: Missing the Right People
Coverage errors occur when the dataset excludes relevant groups. A survey on retirement savings that omits gig workers skews insights.
Table 1: Coverage Error Impact on Retirement Savings Analysis
| Group | True Population % | Survey Coverage % | Bias Introduced |
|---|---|---|---|
| Full-time Employees | 60% | 70% | Overrepresented |
| Gig Workers | 20% | 5% | Underrepresented |
| Self-Employed | 20% | 25% | Slight Overrepresentation |
The survey overestimates savings rates if gig workers save less than full-time employees.
Non-Response Errors: The Data That Never Arrived
Non-response errors stem from participants refusing or failing to provide data. In financial audits, if high-risk clients avoid scrutiny, risk assessments become unreliable.
Adjusting for Non-Response
If response rates differ across strata, I can weight responses to compensate:
Adjusted\ Weight = \frac{Population\ Proportion}{Response\ Proportion}For instance, if small businesses (30% of the population) have only a 10% response rate, their weight triples to balance representation.
Processing Errors: When Human and Systems Fail
Data entry mistakes, coding mishaps, and algorithm misconfigurations fall under processing errors. A single misplaced decimal in financial statements can trigger catastrophic decisions.
Example: The $10 Million Typo
In 2015, a mutual fund reported a $10,000,000 loss as $100,000,000 due to an extra zero. Analysts relying on this overstated loss might have recommended unnecessary corrective actions.
Specification Errors: Wrong Model, Wrong Conclusions
Using an incorrect model—like assuming linear growth when trends are exponential—distorts predictions. In stock valuation, misapplying the Dividend Discount Model (DDM) to non-dividend-paying stocks invalidates results.
Correct vs. Incorrect Specification
- Correct: P = \frac{D_1}{r - g} (DDM for stable dividends)
- Incorrect: Applying DDM to Tesla in 2020 (no dividends).
Mitigating Non-Sampling Errors
No single fix works for all errors, but these strategies help:
- Pre-Testing Surveys – Catch ambiguous questions early.
- Automated Validation Checks – Flag outliers and inconsistencies.
- Imputation for Missing Data – Use statistical methods to fill gaps.
- Cross-Verification – Compare datasets from independent sources.
Table 2: Error Mitigation Techniques
| Error Type | Mitigation Strategy | Example |
|---|---|---|
| Measurement Error | Calibrate instruments | Audit accounting software annually |
| Coverage Error | Expand sampling frames | Include gig workers in labor surveys |
| Non-Response Error | Weighting adjustments | Boost underrepresented group weights |
| Processing Error | Automated data validation | Range checks for transaction amounts |
| Specification Error | Model diagnostics | Test for linearity before regression |
Real-World Case: The 2020 U.S. Census Undercount
The U.S. Census Bureau estimated a 0.24% undercount in 2020, disproportionately affecting minorities. Coverage and non-response errors led to misallocated federal funds and skewed political representation. Corrective statistical modeling cost millions.
Final Thoughts
Non-sampling errors are stealthy but manageable. By recognizing their forms and implementing robust checks, I ensure my analyses stay credible. Whether auditing financial statements or forecasting market trends, vigilance against these errors separates reliable insights from costly mistakes.


