Introduction
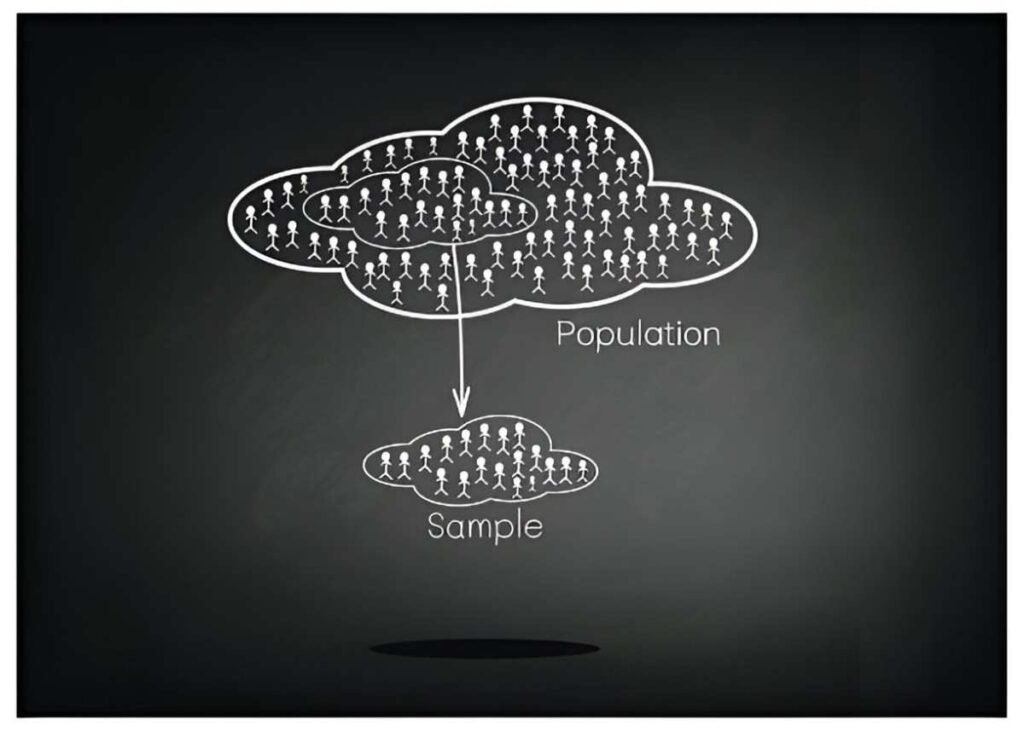
When conducting research, I often need to gather data from a target population. Probability sampling methods like simple random sampling or stratified sampling require a complete list of the population, which is not always feasible. This is where non-probability sampling methods like quota sampling help.
Table of Contents
What Is Quota Sampling?
Quota sampling is a non-probability sampling technique where I divide the population into mutually exclusive subgroups based on certain characteristics like age, gender, or income level. Then, I set quotas to ensure proportional representation. Unlike stratified sampling, quota sampling does not select participants randomly. Instead, I choose them based on convenience or accessibility while maintaining the quota structure.
For instance, if I need a sample of 1,000 respondents, I might decide that 40% should be female and 60% male. If my population is also 30% young adults (18-35), 50% middle-aged adults (36-55), and 20% older adults (56+), I could set quotas accordingly.
| Age Group | Female (40%) | Male (60%) | Total |
|---|---|---|---|
| 18-35 | 120 | 180 | 300 |
| 36-55 | 200 | 300 | 500 |
| 56+ | 80 | 120 | 200 |
| Total | 400 | 600 | 1000 |
This ensures that my sample reflects the population distribution while allowing for cost-effective data collection.
How Quota Sampling Differs from Other Methods
Quota sampling falls under non-probability sampling. It is distinct from probability sampling methods like random sampling, systematic sampling, and stratified sampling. Below is a comparison:
| Feature | Quota Sampling | Stratified Sampling | Simple Random Sampling |
|---|---|---|---|
| Basis of selection | Non-random (based on researcher discretion) | Random (after stratification) | Completely random |
| Population requirement | No need for full population list | Requires full population list | Requires full population list |
| Time efficiency | High | Moderate | Low |
| Cost | Low | Moderate | High |
| Representation | Ensured through quotas | Ensured through random selection | No guaranteed subgroup representation |
Quota sampling provides a practical alternative when a full population list is unavailable. However, since it does not use random selection, it introduces the risk of selection bias.
Example Calculation for Quota Sampling
Let’s assume I am conducting market research for a new product in a city with a population of 500,000. I want a sample of 2,000 respondents, ensuring proportional representation by income groups:
- Low-income (30%)
- Middle-income (50%)
- High-income (20%)
The sample size for each group is determined by:
S_i = S_T \times P_iwhere:
- S_i is the sample size for subgroup i
- S_T is the total sample size
- P_i is the proportion of the subgroup
Applying this:
S_{low} = 2000 \times 0.30 = 600 S_{mid} = 2000 \times 0.50 = 1000 S_{high} = 2000 \times 0.20 = 400Thus, my sample must include:
| Income Group | Percentage | Sample Size |
|---|---|---|
| Low | 30% | 600 |
| Middle | 50% | 1000 |
| High | 20% | 400 |
| Total | 100% | 2000 |
Once these quotas are met, I stop selecting additional respondents from a particular subgroup.
Advantages and Disadvantages of Quota Sampling
Advantages
- Cost-effective – I don’t need a full population list, which reduces data collection costs.
- Time-efficient – Data can be gathered quickly without complex randomization.
- Ensures subgroup representation – Helps in demographic-focused research.
Disadvantages
- Selection bias – Because I handpick participants, it may not accurately represent the population.
- Non-generalizable results – Findings may not apply beyond the sample.
- Potential researcher bias – Personal judgment can affect sample composition.
When to Use Quota Sampling
Quota sampling is suitable when:
- A complete population list is unavailable.
- Time and budget constraints prevent probability sampling.
- I need to ensure the inclusion of specific subgroups.
- The research focuses on consumer preferences, social trends, or preliminary studies.
Conclusion
Quota sampling provides a structured yet flexible way to gather data efficiently. It is not as rigorous as probability sampling, but it ensures representation within practical constraints. Understanding its strengths and weaknesses helps me apply it effectively, balancing convenience with methodological soundness.


